How to Learn Candlestick Patterns in 4 Weeks
Thomas Bulkowski tested 103 candlestick patterns in his Encyclopedia of Candlestick Charts (2008), and the result should change how you study them: most patterns barely beat random entries on their own. The fastest way to learn candlestick patterns is to study a few of them in a fixed order, always against trend, location and volume, and to drill them on historical charts until the read is automatic. This guide lays out that order as a four-week plan for swing traders.
Why Most Traders Learn Candlestick Patterns Backwards
Most beginners memorise a poster of 30 or 40 named shapes, then hunt for those shapes on live charts. That sequence produces the opposite of skill: every chart seems to contain a pattern, and none of them seems to work.
Steve Nison brought candlestick charting to Western traders in Japanese Candlestick Charting Techniques (1991), and his own advice was to combine candles with Western tools such as support, resistance and volume rather than trade them alone. Academic work points the same way. Marshall, Young and Rose (2006), published in the Journal of Banking & Finance, tested candlestick strategies on Dow Jones Industrial Average stocks and found no evidence that they produced excess returns on their own.
The lesson is about learning order, not about whether candles are useful. Candles are a vocabulary for describing a day of trading. You learn a vocabulary by using it in sentences, and the sentence for a swing trader is "trend, location, candle, volume".
A better sequence has three parts:
- Anatomy first. Learn what a single candle records before you name any pattern.
- Context second. Learn to read the trend and the price level the candle prints at.
- Patterns last. Add named patterns one at a time, only after the first two layers are automatic.
How to Learn Candlestick Patterns in Four Weeks
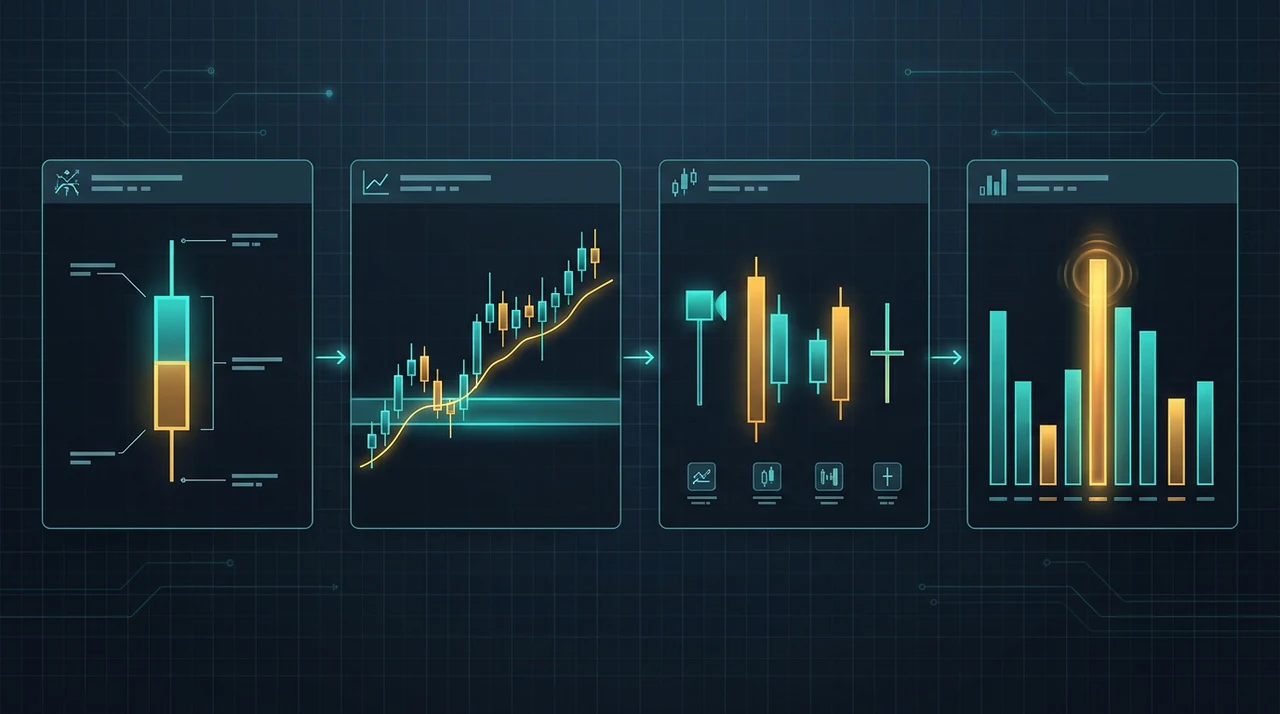
A four-week plan gives you a fixed order and a finish line. Spend 20 to 30 minutes a day on historical charts, not on live positions. Each week adds one layer, and each layer gets tested before the next begins.
| Week | Focus | What you can do at the end |
|---|---|---|
| 1 | Candle anatomy | Describe any daily candle in one sentence |
| 2 | Trend and location | Say which stage a stock is in and where support sits |
| 3 | Four core patterns | Spot hammer, engulfing, inside bar and doji in context |
| 4 | Volume and confirmation | Grade a pattern from weak to strong using a written rule |
Week 1: Read One Candle at a Time
A candle holds four prices: open, high, low and close. The body shows where the session started and ended, and the wicks show how far price travelled and then got rejected. That is all a candle contains.
Open a daily chart and describe 50 candles aloud, one sentence each: "Wide body, closed near the high, small upper wick, buyers in control." Do not name patterns this week. Naming comes later, and describing first builds the habit of reading what actually happened.
Nison's central idea is that the relationship between open and close matters more than the high and low. Watch for three things: body size relative to the last 10 candles, wick length relative to the body, and where the close sits inside the day's range.
Week 2: Add Trend and Location
A candle means nothing without the surrounding chart. The same hammer shape is a pullback bounce inside an uptrend and a falling-knife trap inside a decline.
This week, label every chart with two facts before looking at any candle. First, the trend: use the Stage 2 framework to decide whether the stock is advancing, topping, declining or basing. Second, the location: mark the nearest support and resistance levels and the 21-day and 50-day moving averages.
Lo, Mamaysky and Wang (2000) showed in the Journal of Finance that several chart patterns on US stocks carried incremental information once identified with consistent, rule-based definitions. Consistent rules are the point: write your trend and location labels down in the same format every time.
Week 3: Learn Four Patterns, Not Forty
Four patterns cover most of what swing traders act on. Learn each one's shape, the story it tells and the location where it matters.
- Hammer: a small body near the top of the range with a long lower wick. Sellers pushed price down and buyers reclaimed it.
- Bullish engulfing: a green body that fully covers the prior red body. Demand overpowered the previous day.
- Inside bar: a candle whose range sits entirely inside the prior candle's range. Volatility is contracting, which is why it appears inside VCP bases.
- Doji: open and close nearly equal. It signals indecision, and it only matters at an extreme.
For the full list of ten with trade context, use the top 10 candlestick patterns guide as your reference. Do not add a fifth pattern until you can find all four on historical charts, at the right location, without checking notes.
Week 4: Add Volume and a Confirmation Rule
Week 4 turns shapes into graded evidence. Pair each pattern with relative volume, which compares the day's volume to the 20-day average, and with a confirmation rule.
A simple written rule works: the pattern counts only if the next session closes beyond the signal candle's high (for a bullish read) and the signal candle printed on at least average volume. Our volume analysis guide covers relative volume in detail.
By the end of the week you should be able to look at a chart and say "weak hammer, below-average volume, in a downtrend, skip" or "strong engulfing, 1.6x volume, at the 50-day average in a Stage 2 uptrend, watch". That sentence is the skill.
Practice Methods That Make Candlestick Patterns Stick
Reading about patterns builds recognition. Using them builds judgement. Three practice methods close the gap.
Hide the Right Side of the Chart
Scroll a daily chart back one to two years, cover everything to the right of a candle you picked, and decide what you would do. Then reveal the next five sessions. This bar-by-bar replay is the closest you can get to live conditions without risking capital.
Anders Ericsson, Ralf Krampe and Clemens Tesch-Römer (1993) found that expert performance in music, chess and sport tracked hours of deliberate practice, meaning focused work with immediate feedback, far better than hours of experience. Replay drills give you that feedback loop: you commit to a read, then see the result right away.
Keep a Pattern Log
Screenshot every pattern you take seriously and record five fields: trend, location, relative volume, confirmation and outcome after five days. After 30 entries you will have your own data on which patterns work in which context, which beats any textbook win rate.
A trading journal covers the same discipline for real trades. The pattern log is the paper-trade version of it.
Space Your Reviews
Review the four patterns in short sessions spread across days rather than in one long block. Cepeda and colleagues (2006), in a meta-analysis in Psychological Bulletin covering 317 experiments, found that spaced practice produced better long-term retention than massed practice with the same total study time. Ten minutes on four separate days beats 40 minutes once.
Common Mistakes When You Learn Candlestick Patterns
Most failed attempts to learn candlestick patterns come from the same few habits. Each has a direct fix.
| Mistake | Why it hurts | Fix |
|---|---|---|
| Memorising 40 shapes | No shape is recognised under pressure | Master four, then add one at a time |
| Ignoring the trend | Reversal candles in chop reverse nothing | Label the stage before reading any candle |
| Skipping volume | A reversal on thin volume is a suggestion only | Require average or above-average volume |
| Trading the signal candle itself | A hammer is not validated until it holds | Wait for the next session's close |
| Practising on live positions | Money amplifies bias | Drill on historical charts first |
| Judging by one example | One win proves nothing | Log 30 or more instances |
The habit behind most of these is chasing a pattern name instead of reading a chart. When the name is the goal, any shape that resembles it feels like a signal. When the chart is the goal, the name is just shorthand for a story you already understand.
How EasySwing Fits Into Candlestick Practice
EasySwing does not publish candlestick patterns as stand-alone scan results. The only candle test inside its setups is a "bounce candle" in the pullback setups: a bar that takes out the prior day's high, closes in the upper half of its range and closes above the prior close.
That structure helps with practice. The daily setup list gives you a stream of charts already filtered for trend and relative strength, and each setup carries a grade on the A+, A, B+, B and C scale. You can open any setup, find the candle that formed at the trigger area and run your week-4 grading sentence on it. Checking your read against the screener's grade shows where your judgement and the rules differ.
The pullback to a rising MA setup is the best one to practise on, because its trigger is a bounce candle (a bar that takes out the prior high and closes in the upper half of its range) after price pulls back into the EMA9/EMA20 zone on declining volume. Pair this with the market regime reading: candle patterns that work in a trending market often fail in a choppy one, so practise in both and log the difference.
Practical Checklist
Use this before you count any candlestick read as a valid signal during practice:
- ✅Describe the candle in plain words before naming the pattern
- ✅Label the trend stage and nearest support or resistance first
- ✅Confirm relative volume against the 20-day average
- ✅Wait for a confirming close in the next session
- ✅Log trend, location, volume, confirmation and five-day outcome
- ✅Review the same four patterns on spaced days, not in one block
- ❌Avoid adding a new pattern before the last one is automatic
- ❌Avoid reading reversal candles in a sideways or choppy tape
- ❌Avoid treating the pattern name as the reason for a trade
- ❌Avoid judging a pattern from a single winning example
A learner who clears the first four items on most practice charts is ready to watch live setups. One who skips them will mostly learn to see patterns everywhere.
EasySwing screens for swing setups automatically, with a bounce-candle check built into its pullback setups. Keep learning with the top 10 candlestick patterns guide, the technical analysis guide for swing trading and the beginner's guide to swing trading. Scan results are for informational purposes only. See our Risk Disclaimer.
FAQ
How long does it take to learn candlestick patterns?
Most traders can learn to read single candles and four core patterns in about four weeks at 20 to 30 minutes a day. Reading charts with real judgement takes longer, since it depends on logging 30 or more examples of each pattern and seeing how it behaves in different trends. The first month builds recognition. The next few months build the context filter that makes the patterns usable.
What is the best order to learn candlestick patterns?
Start with candle anatomy (open, high, low, close, body and wicks), then add trend and support or resistance, then learn four patterns: hammer, bullish engulfing, inside bar and doji. Add volume and a confirmation rule last. This order keeps every pattern tied to the context that decides whether it matters.
Do I need to memorise all candlestick patterns?
No. Bulkowski's Encyclopedia of Candlestick Charts (2008) tested 103 patterns, and most added little on their own. Swing traders get most of the value from a handful of patterns read in the right trend and location. A small set you can recognise instantly is more useful than a long list you have to look up.
Can I learn candlestick patterns without risking money?
Yes, and that is the better way to start. Use historical charts with the right side hidden, decide what you would do, then reveal the next sessions. Combine this with a pattern log that records trend, location, volume, confirmation and the five-day outcome. Only move to live charts once your written rules produce consistent reads.
Are candlestick patterns enough to trade on their own?
Not in the evidence we have. Marshall, Young and Rose (2006) found no excess returns from candlestick strategies on Dow Jones stocks, and Nison himself recommends combining candles with support, resistance and volume. Treat a pattern as one input that gets graded alongside trend, location and relative volume, not as a standalone reason for a trade.
Frequently Asked Questions
How long does it take to learn candlestick patterns?
Most traders can learn to read single candles and four core patterns in about four weeks at 20 to 30 minutes a day. Reading charts with real judgement takes longer, since it depends on logging 30 or more examples of each pattern and seeing how it behaves in different trends. The first month builds recognition. The next few months build the context filter that makes the patterns usable.
What is the best order to learn candlestick patterns?
Start with candle anatomy (open, high, low, close, body and wicks), then add trend and support or resistance, then learn four patterns: hammer, bullish engulfing, inside bar and doji. Add volume and a confirmation rule last. This order keeps every pattern tied to the context that decides whether it matters.
Do I need to memorise all candlestick patterns?
No. Bulkowski's Encyclopedia of Candlestick Charts (2008) tested 103 patterns, and most added little on their own. Swing traders get most of the value from a handful of patterns read in the right trend and location. A small set you can recognise instantly is more useful than a long list you have to look up.
Can I learn candlestick patterns without risking money?
Yes, and that is the better way to start. Use historical charts with the right side hidden, decide what you would do, then reveal the next sessions. Combine this with a pattern log that records trend, location, volume, confirmation and the five-day outcome. Only move to live charts once your written rules produce consistent reads.
Are candlestick patterns enough to trade on their own?
Not in the evidence we have. Marshall, Young and Rose (2006) found no excess returns from candlestick strategies on Dow Jones stocks, and Nison himself recommends combining candles with support, resistance and volume. Treat a pattern as one input that gets graded alongside trend, location and relative volume, not as a standalone reason for a trade.
Disclaimer: This article is for educational purposes only and does not constitute investment advice. EasySwing is a stock screening tool, not a registered investment advisor. All trading involves risk. Read our full disclaimer →