Stage 2 Stock Analysis: How to Find Stocks in a Mark Minervini Uptrend
Nine out of ten stocks that gained 100% or more in a single year were already trading above a rising 50-day, 150-day, and 200-day moving average stack before their major advance (O'Neil, How to Make Money in Stocks, 4th ed., 2009). That stack is the technical signature of Stage 2 — Stan Weinstein's name for the advancing phase of a stock's four-phase market cycle — and it is the first filter EasySwing applies before any setup is graded.
Stage Analysis: The Four-Phase Market Cycle
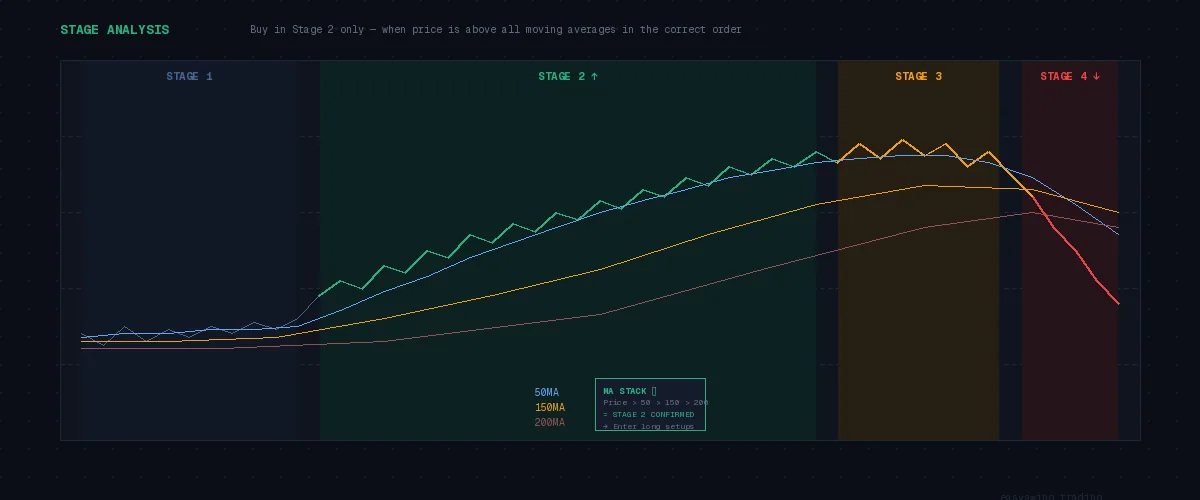
Stan Weinstein's Stage Analysis, published in Secrets for Profiting in Bull and Bear Markets (1988), divides the life of any stock or index into four repeating phases based on price structure and moving-average behavior, not news or fundamentals. EasySwing only surfaces long setups from Stage 2 — the other three phases are filtered out regardless of how attractive an individual pattern looks.
- Stage 1: Basing/accumulation — price moves sideways after a decline, volume dries up
- Stage 2: Advancing — the big move; price trends upward with rising moving averages
- Stage 3: Distribution/topping — price stalls, choppier action, institutions selling
- Stage 4: Declining — downtrend, price below falling moving averages
| Stage | Price Action | Volume Behavior | Moving Averages | What To Do |
|---|---|---|---|---|
| 1 — Basing | Sideways, narrowing range | Dries up | Flattening, converging | Watch — do not buy yet |
| 2 — Advancing | Higher highs, higher lows | Expands on up-days | Stacked bullish, all rising | Buy pullbacks and breakouts |
| 3 — Topping | Choppy, wide two-way swings | Erratic, heavy distribution days | Flattening or crossing down | Trim or exit — stop adding |
| 4 — Declining | Lower highs, lower lows | Expands on down-days | Stacked bearish, all falling | Avoid — do not buy |
The core insight: you want to buy in Stage 2 and only Stage 2. Buying in Stage 1 is premature — the base hasn't resolved yet. Buying in Stage 3 or 4 means fighting institutional selling. As Weinstein put it, "the single most important rule is to never buy a stock in Stage 4."
The Stage 2 Criteria
EasySwing checks five specific conditions against each stock's price history and combines them into a 0–5 Trend Template score, adapted from Mark Minervini's SEPA (Specific Entry Point Analysis) methodology. A stock earns the S2 tag once at least four of the five conditions are true — not necessarily all five.
The five conditions:
- Price is above its 50-day moving average
- The 50-day average is above the 150-day average
- The 150-day average is above the 200-day average
- The 200-day average is trending upward (higher than it was roughly a month ago)
- Price is within 25% of its 52-week high
Minervini's SEPA framework layers on additional confirmation beyond the moving-average structure: relative strength rank in the 70+ range (ideally 90+), and a positive earnings trend. EasySwing applies RS rank as a separate, independent filter alongside the Trend Template score rather than folding it into the same check — so a stock can be a confirmed S2 uptrend and still fail the leadership bar if its RS rank is weak.
The Trend Template Score: Why 4 of 5 Beats a Rigid Checklist
Requiring all five Stage 2 conditions simultaneously would exclude plenty of genuinely strong uptrends over one borderline reading — most often the 52-week-high proximity condition during a normal, healthy pullback. The 4-of-5 threshold captures that nuance without loosening the standard on the moving-average stack itself, which all three qualifying scores still require in some form.
| Trend Template Score | What It Means |
|---|---|
| 5 / 5 | Textbook Stage 2 — every condition confirmed, full institutional participation |
| 4 / 5 | Confirmed Stage 2 — one condition borderline, commonly the 52-week-high proximity mid-pullback |
| 3 / 5 or lower | Not yet Stage 2 — still in Stage 1, transitioning, or showing early Stage 3 cracks |
EasySwing computes this score for every stock in its 2,000+ stock universe on each enrichment pass and stores both the pass/fail S2 tag and the underlying 0–5 score, so a stock sitting at 3/5 today can be tracked as it approaches confirmation.
Why Stage 2 Matters
The reason Stage 2 is so important is compounding probability. When a stock satisfies the Stage 2 criteria:
- Institutional investors have already been accumulating (hence the Stage 1 → Stage 2 transition)
- The trend is your ally — you're not trying to guess a bottom, you're riding established momentum
- Risk is lower — a stock in a confirmed uptrend with a rising 200-day MA provides a natural backstop; if the MA starts turning down, you have an early exit signal
Jegadeesh and Titman's momentum research (Journal of Finance, 1993) found that trend-following strategies generated roughly 12% annualized excess returns, with the effect concentrated almost entirely in favorable trending conditions — precisely the environment the Stage 2 filter is designed to isolate. Empirically, the majority of the biggest winning stocks show Stage 2 characteristics at the time of their major breakouts: the O'Neil study cited above found 9 out of 10 stocks that gained 100%+ in 12 months were already above a rising 200-day MA with the stack confirmed at the start of their move.
Moving Average Stack: The MA Stack Check
EasySwing automatically checks the "MA stack" — the hierarchical ordering of moving averages that anchors the Stage 2 criteria:
Price > 50-day MA > 150-day MA > 200-day MAWhen at least four of the five Trend Template conditions are true — including a rising 200-day MA — the stock receives the S2 tag. This is one of the first filters EasySwing applies during enrichment; stocks not in Stage 2 are deprioritized regardless of other signals, since a pattern that looks clean in Stage 1 or Stage 3 carries meaningfully worse odds than the identical pattern inside a confirmed Stage 2 trend.
The Stage 1-to-2 Transition
The most explosive moves often happen right at the transition from Stage 1 (base) to Stage 2 (uptrend). The signal traders watch for is a high-volume breakout above the Stage 1 base — the stock clears a long-term resistance level with conviction.
What experienced Stage-2 traders look for at the transition:
- A base of at least 3–6 weeks (the longer the base, the more powerful the breakout tends to be)
- Volume on the breakout day meaningfully above the recent average — commonly cited as 2–3× the 50-day average
- Price closing in the upper half of the day's range
- The RS line (relative strength vs. the S&P 500) making a new high before or on the breakout day
These are manual confirmation cues traders layer on top of the Trend Template score — EasySwing's automated S2 tag confirms the moving-average structure; volume and RS-line behavior at the transition point are additional context worth checking on the chart itself.
Stage 2 in Different Market Environments
Stage 2 analysis works across all market caps, but tends to work best for small and mid-cap stocks where institutional ownership is lower and pricing is less efficient. EasySwing focuses on stocks with market caps between $200M and $20B — the range where Stage 2 breakouts have historically produced the strongest swing trading returns.
In a broad market downtrend, even individually confirmed Stage 2 stocks can correct sharply when the overall market falls — trend-following systems built on the S&P 500's own 200-day MA consistently show reduced drawdown when new long entries are restricted to periods when the broad market is above its own rising average (Clenow, Stocks on the Move, 2015). EasySwing's market regime detection applies this same logic at the macro level, gating which setups surface based on whether the broad market itself is trending up, ranging, or trending down.
Common Stage 2 Mistakes
- ✅Wait for the Trend Template score to hit 4 or 5 before treating a stock as confirmed Stage 2
- ❌Buy a stock scoring 3/5 or lower, hoping it "gets there" — that's still Stage 1 or an early false start
- ✅Pair Stage 2 confirmation with an RS rank check before acting — leadership and trend structure are separate filters
- ❌Ignore RS rank — a Stage 2 stock with weak relative strength is often just drifting with a rising market, not leading it
- ✅Require the full moving-average stack (50-day > 150-day > 200-day) before acting on the signal
- ❌Treat a single day's close above the 50-day MA as full Stage 2 confirmation
- ✅Prioritize setups within a reasonable distance of a valid base or pivot
- ❌Chase Stage 2 stocks that are already 40–50%+ above their most recent base — the risk/reward has already deteriorated
Practical Checklist for a Stage 2 Stock
- ✅ Price above the 50-day, 150-day, and 200-day moving averages, stacked in that order
- ✅ 200-day moving average trending upward over the past month
- ✅ Price within 25% of its 52-week high
- ✅ At least 4 of these 5 Trend Template conditions confirmed (score ≥ 4)
- ✅ RS rank ≥ 70 (ideally ≥ 90) for genuine market leadership
- ✅ No Stage 3/4 characteristics — no rounding-over top, no death cross forming
EasySwing screens for Stage 2 stocks across 2,000+ US equities automatically. Once you've identified Stage 2 stocks, look for VCP patterns as entry triggers and use RS rank to confirm leadership. New to swing trading? Start with What is Swing Trading?. Scan results are for informational purposes only. See our Risk Disclaimer.
Frequently Asked Questions
What is Stage 2 in stock analysis?
Stage 2 is the advancing phase in Stan Weinstein's four-stage market cycle framework (*Secrets for Profiting in Bull and Bear Markets*, 1988). It is defined by price trending above a rising moving average stack: price > 50-day MA > 150-day MA > 200-day MA, with the 200-day MA sloping upward. According to research cited by O'Neil, 9 out of 10 stocks that gained 100%+ in 12 months were in Stage 2 at the start of their move.
How do you identify a Stage 2 stock?
Check five criteria: (1) price is above the 50-day moving average; (2) the 50-day average is above the 150-day average; (3) the 150-day average is above the 200-day average; (4) the 200-day average is trending upward; and (5) price is within 25% of its 52-week high. EasySwing computes all five automatically for every stock and tags it S2 once at least four of the five are true.
Does a stock need to meet all 5 Stage 2 criteria?
No — EasySwing requires at least 4 of the 5 Trend Template conditions, not a perfect 5/5. This avoids excluding genuinely strong uptrends over one borderline reading, most commonly the 52-week-high proximity condition during a normal, healthy pullback. The moving-average stack itself (50-day > 150-day > 200-day) is still required in every qualifying combination.
What is the MA stack in Stage 2 analysis?
The MA stack is the required hierarchy of moving averages: Price > 50-day MA > 150-day MA > 200-day MA, all trending upward. When these levels are stacked in this order, the broad institutional trend is confirmed bullish. A breakdown in the stack — such as the 50-day crossing below the 150-day — signals the onset of Stage 3 distribution and is a warning to tighten stops or exit.
Why should you only buy stocks in Stage 2?
Buying in Stage 2 means institutional investors have already confirmed the uptrend — you are following smart money rather than guessing a bottom (Stage 1) or chasing a top (Stage 3 or 4). As Weinstein stated in *Secrets for Profiting in Bull and Bear Markets* (1988), "the single most important rule is to never buy a stock in Stage 4." Staying in Stage 2 dramatically improves the probability that a setup follows through before the trend reverses.
How long do Stage 2 uptrends typically last?
Stage 2 uptrends can run from a few months to several years depending on the stock and market cycle. Minervini's research shows the biggest winning trades tend to come from stocks that remain in Stage 2 for 12–36 months, allowing multiple re-entry opportunities on new base formations. For swing trading, individual setups within a Stage 2 stock typically last 2–6 weeks before requiring a fresh entry signal.
Disclaimer: This article is for educational purposes only and does not constitute investment advice. EasySwing is a stock screening tool, not a registered investment advisor. All trading involves risk. Read our full disclaimer →