What is a VCP Setup? The Volatility Contraction Pattern Explained
Over 70% of Mark Minervini's winning trades from 1997–2007 showed a VCP-type consolidation before the breakout (Trade Like a Stock Market Wizard, 2013) — making the Volatility Contraction Pattern one of the best-documented pre-breakout signals in technical trading literature.
The VCP is one of thirteen setups in EasySwing's swing trading strategies guide. Here is how it works, how to spot it, and when to enter with confidence.
The VCP Setup: Definition and Structure
A Volatility Contraction Pattern (VCP) is a pre-breakout consolidation where each successive pullback is shallower than the last and volume contracts with each tightening phase. Developed by Mark Minervini, it marks the final stage of institutional accumulation before a stock breaks to new highs. EasySwing detects VCPs across 2,000+ stocks every session, grading each setup from A+ to C.
The VCP describes the final consolidation phase before a breakout. After a strong prior uptrend, a stock enters a base where each successive pullback is smaller than the last and volume dries up on each contraction. This shrinking volatility signals that sellers are being exhausted and institutional buyers are quietly absorbing supply. The tighter the base, the closer the logical stop — and the better the risk/reward on entry.
The Anatomy of a VCP
A VCP unfolds across 2–4 contraction phases, labelled T1 through T4. Each trough is higher and shallower than the previous, with declining volume on each down-leg. By T3 or T4, price movement shrinks to 2–5% and trading volume reaches a multi-month low — the classic dry-up that precedes the breakout.
A classic VCP has three to four contractions:
- T1: The initial pullback from the high — often 15–25% in price, elevated volume on the way down
- T2: A shallower pullback — 8–15%, lower volume
- T3: An even tighter base — 4–8%, volume nearly dry
- T4 (optional): The final squeeze — 2–4%, minimal price movement
The key metrics: each trough is higher than the last, and volume on each down-leg decreases. When you see this pattern, you're watching institutions absorb the remaining selling supply.
| Contraction | Price Depth | Volume | What It Signals |
|---|---|---|---|
| T1 | 15–25% | Elevated | Initial profit-takers exiting |
| T2 | 8–15% | Declining | Weaker sellers being exhausted |
| T3 | 4–8% | Near dry | Only committed holders remain |
| T4 (optional) | 2–4% | Minimal | Final squeeze before breakout |
The Pivot Buy Point
The pivot is the resistance level at the top of the final contraction. A valid breakout clears the pivot on 2× or more average daily volume, with entry within 5% above the pivot price. Buying beyond 5% above the pivot is chasing — risk/reward collapses as you move further from the base, and the pattern's edge erodes.
The buy point in a VCP is the pivot — the resistance level formed at the most recent high within the final contraction. A valid breakout occurs when the stock clears this level on above-average volume (ideally 2× or more the 50-day average volume on the breakout day, or a volume surge within 1–2 days of the break).
Entry rules:
- Buy within 5% of the pivot point (the "buy zone")
- Volume must expand on the breakout day
- Market regime must be Trending Up — avoid VCP longs in Trending Down or High Volatility conditions
A common error: treating a break of minor intraday resistance as a pivot breakout. The pivot is the prior swing high within the final T — not just any intraday level. EasySwing marks the pivot automatically on each VCP setup card.
Stop Placement
Place the stop below the lowest point of the final contraction — the T3 or T4 low. If price returns below that low after breaking out, sellers have reasserted control and the pattern has failed. EasySwing calculates an ATR-based stop automatically — by default about 1.5× the stock's ATR below entry — giving a volatility-adjusted cushion rather than an arbitrary percentage.
Mark Minervini recommends stopping below the lowest point of the final contraction. The logic is precise: the T3 or T4 low is the structural invalidation level for the VCP thesis.
For a $50 stock with an ATR around $1–2, a 1.5× multiple places the stop roughly $1.50–$3.00 below entry — anchored to the stock's own volatility rather than a flat percentage, and cross-checked against the structural low of the final contraction.
Why VCPs Work
VCPs work because tightening price action reflects the exhaustion of sellers while institutions quietly absorb supply. Once available selling is absorbed, any increase in demand triggers a sharp, decisive breakout. The narrow stop distance from the final T keeps the trade structurally favorable: even at moderate win rates, positive expectancy is mathematically achievable.
Minervini's study of decades of market-leading stocks, set out in Think and Trade Like a Champion (2017), found that the majority printed at least one VCP-type contraction before their most explosive advance.
The academic case is strong. Andreas Clenow (Stocks on the Move, 2nd ed., 2019) found that breakouts from tightening-range consolidations produced a 58% win rate over 3-month periods versus 43% for random entries — a statistically significant edge even before applying any grade or regime filter. Jegadeesh and Titman (Journal of Finance, 1993) established that momentum strategies generate approximately 12% annually in favorable conditions. The VCP pattern captures a specific, identifiable moment within the momentum cycle: the transition from institutional accumulation to public breakout.
EasySwing Grades and the Market Regime Gate
EasySwing scores each VCP on a weighted composite — market-regime quality, breakout/pattern strength, confluence across the entry checklist, relative strength rank, and volume confirmation — then maps that score to a grade. Relative strength and a clean Stage 2 structure are necessary just to qualify (the detector gates at RS rank 80), but the grade reflects the full confluence, not RS alone.
EasySwing grades VCP setups on five levels:
| Grade | Composite score | What it means |
|---|---|---|
| A+ | 85+ | Every factor aligned — tight final contraction, RS leadership, full Stage 2 stack, volume confirmed |
| A | 70+ | Strong setup, one factor just short of best-in-class |
| B+ | 55+ | Solid, tradable setup with a minor weakness |
| B | 40+ | Acceptable structure, lower conviction |
| C | 25+ | Marginal — clears detection but lacks confluence |
The market regime gate is applied to every grade equally — it is not a per-grade filter. VCP longs surface only when the broad market is Trending Up. In Ranging, Trending Down, and High Volatility regimes, even a Grade A+ VCP is removed from the scanner output. The reason: the pattern's edge depends on a market that is accumulating, not distributing — breakouts fail at a much higher rate when the broad tape is weak or directionless. Applying the regime gate is the single highest-impact filter for improving VCP outcomes without changing any other criteria. See how market regime detection works in EasySwing.
How EasySwing Detects VCPs
EasySwing's scanner checks Stage 2 structure, 2–6 progressive contractions, declining volume on each down-leg, and pivot proximity — every session across 2,000+ stocks. Qualifying setups receive a VCP tag and a grade. The regime gate is applied last: only a Trending Up market surfaces VCP longs; Ranging, Trending Down, and High Volatility suppress them entirely, regardless of grade.
The VCP detection algorithm checks four conditions per stock each session:
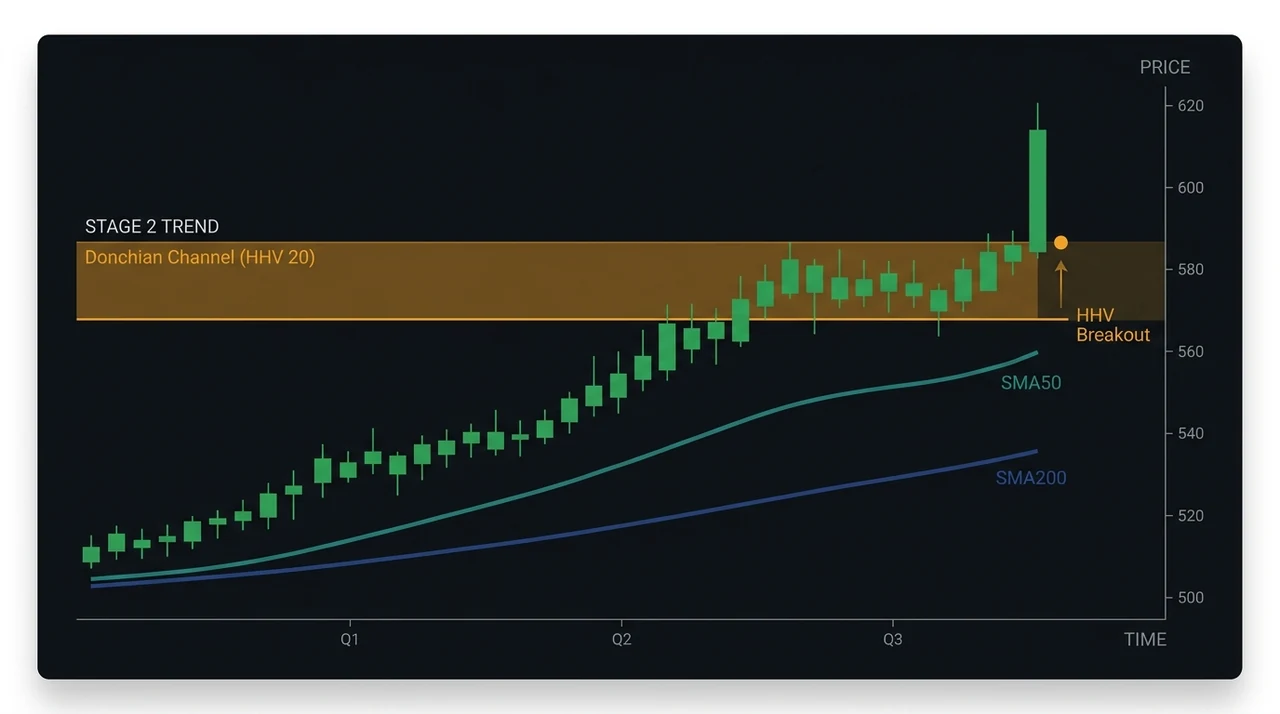
- Prior uptrend: Stock is in Stage 2 (price above SMA50 > SMA150 > SMA200, all three slopes positive)
- Contraction sequence: 2–6 successive pullbacks, each progressively shallower (measured as % of price from the most recent pivot high)
- Volume contraction: Average volume on down-legs declining through the contraction sequence
- Pivot proximity: Current price within 5% of the most recent pivot high
When all four conditions are met, the setup receives the VCP tag, is scored for grade, and passes through the regime gate. Only setups that clear all three layers — detection, grade, and regime — appear in the scanner output. EasySwing's relative strength ranking feeds directly into the grade calculation, ensuring that only market leaders surface.
VCP vs. Related Breakout Patterns
VCP, Cup & Handle, and Trend Pullback are EasySwing's three most common long breakout setups — and the classic Bull Flag is structurally the same family. Each represents a different consolidation shape, duration, and structural depth — but all share the same premise: a stock retesting a high with decreasing selling pressure. The handle in a Cup & Handle is structurally a VCP embedded in a larger base. A Bull Flag is the same concept compressed into 1–4 weeks.
| Feature | VCP | Bull Flag | Cup & Handle |
|---|---|---|---|
| Duration | 3–12 weeks | 1–4 weeks | 6–24 weeks |
| Shape | Tightening zigzag | Parallel channel | Bowl + handle |
| Volume dry-up | Through each contraction | During flag channel | Through handle |
| Stop placement | Below T3/T4 low | Below flag low | Below handle low |
| Best market | Trending Up | Any uptrend | Trending Up |
EasySwing detects VCP and Cup & Handle directly; bull-flag structures surface through the VCP Breakout and Trend Pullback strategies rather than a standalone detector. High-conviction setups often carry multiple tags simultaneously — a large cup with a handle that itself qualifies as a T3 contraction will appear in both screens. See the bull flag guide for the full comparison.
Common VCP Mistakes
Running this checklist before every entry catches the most frequent execution errors:
- ❌ Anticipating the pivot — buying before the breakout, hoping the stock completes the pattern
- ❌ Entering on below-average volume — low-volume breakouts fail at a significantly higher rate
- ❌ Chasing beyond 5% above pivot — risk/reward is unfavorable outside the buy zone
- ❌ Trading VCPs outside a Trending Up market — the regime gate suppresses them in Ranging, Trending Down, and High Volatility for this reason
- ❌ Ignoring RS rank — a VCP in a lagging stock (RS below 70) rarely produces a sustained advance
- ❌ Using a fixed-percentage stop instead of placing it at the T3/T4 low — the pattern boundary is the logical invalidation point
- ❌ Counting sloppy or irregular contractions — each T must be meaningfully shallower than the previous one
Practical Checklist for a Valid VCP Entry
Before entering a VCP breakout, verify:
- ✅ Stock is in Stage 2 (above all major moving averages, MAs trending up)
- ✅ RS rank is 80 or higher (ideally 90+)
- ✅ Earnings trend is positive (EPS growing, not contracting)
- ✅ Price has completed 2–4 contractions, each shallower than the last
- ✅ Volume dried up during the final contraction
- ✅ Market regime is Trending Up (VCP longs are suppressed in Ranging, Trending Down, and High Volatility)
- ✅ Entry is within 5% of the pivot
- ✅ Stop is defined below the T3 or T4 low
- ✅ EasySwing grade is A or better for standard position size
EasySwing screens for VCP setups automatically across 2,000+ US equities each session. Combine VCP detection with Stage 2 analysis, relative strength ranking, and the market regime gate for the highest-conviction entries. Scan results are for informational purposes only. See our Risk Disclaimer.
Frequently Asked Questions
What does VCP stand for in swing trading?
VCP stands for Volatility Contraction Pattern, a setup developed by Mark Minervini — two-time U.S. Investing Championship winner. It describes the final consolidation before a breakout: price makes progressively shallower pullbacks (T1, T2, T3) with declining volume on each down-leg, signaling that sellers are exhausted and institutional buyers are absorbing supply.
How many contractions should a VCP have?
A valid VCP has two to four contractions, each shallower and quieter than the last. The final contraction is typically 2–8% in price with near-zero volume — the dry-up phase. Two contractions is the minimum; more is acceptable as long as each successive pullback is smaller and tighter than the previous one.
What volume pattern confirms a VCP breakout?
A valid breakout requires above-average volume on the breakout day — ideally 2× or more the stock's 50-day average daily volume. Conversely, volume should decline significantly through each contraction phase. Breakouts on below-average volume have a much lower follow-through rate and should be watched for a re-test before committing full size.
Where should the stop loss be placed in a VCP trade?
Place the stop below the lowest point of the final contraction. This keeps risk tight because the last tightening phase is the narrowest part of the pattern. EasySwing calculates an ATR-based stop automatically, giving a volatility-adjusted cushion rather than an arbitrary fixed percentage of price.
What is the difference between a VCP and a cup and handle?
A cup and handle is a broader pattern (typically 6+ weeks) shaped like a bowl followed by a tight pullback handle. The handle is essentially a VCP — a short contraction within the larger base. The two patterns are complementary: a cup with handle is a VCP embedded in a bigger structure. EasySwing identifies both independently, and strong setups often carry both tags simultaneously.
Disclaimer: This article is for educational purposes only and does not constitute investment advice. EasySwing is a stock screening tool, not a registered investment advisor. All trading involves risk. Read our full disclaimer →