Swing Trading Journal: How to Track Setups and Build a Real Edge
Van Tharp documented in Trade Your Way to Financial Freedom (1998) that a trader's system expectancy — the average R-multiple per trade — can only be reliably computed from journal data across 30 or more closed trades. A swing trading journal is not a diary; it is the measurement system that tells you whether your edge is real.
Short answer: A swing trading journal records every trade's entry price, exit price, setup type, stop level, R-multiple outcome, and market regime. Review 30–50 journal entries to compute your actual win rate, average winner, average loser, and expectancy by setup type. This data tells you which setups are producing genuine edge — and which are costing you capital.
Why a Trading Journal Is Your Most Valuable Tool
Most swing traders attribute losses to bad luck and winners to skill. A journal replaces that narrative with data: a specific setup is producing negative expectancy in choppy regimes; a specific hold time is cutting winners short; a specific position size is producing inconsistent R-multiples.
Dr. Brett Steenbarger, trading psychologist and author of Enhancing Trader Performance (2007), found that traders who conducted structured post-session reviews improved their performance metrics more rapidly than those who added new indicators or screeners. The journal creates the feedback loop that shortens the learning curve.
Mark Minervini writes in Think and Trade Like a Champion (2017): "The journal is where you discover your real statistics — not the ones you want to have, but the ones you actually have." Without those statistics, every decision to add or drop a setup is a guess.
What to Record on Every Swing Trade
The minimum viable journal entry has ten fields. Add more once the habit is established — complexity is the enemy of consistency in the early weeks.
| Field | What It Captures | Example |
|---|---|---|
| Date entered | Trade start date | 2026-04-14 |
| Ticker | Stock symbol | NVDA |
| Setup type | Which strategy triggered | VCP Breakout |
| Grade at entry | A+/A/B+/B/C quality score | A |
| Entry price | Actual fill | $127.50 |
| Stop price | Pre-set stop level | $121.85 |
| Initial R | Dollar risk per share | $5.65 |
| Market regime | Bull / Bear / Choppy at entry | Bull |
| Date exited | Trade close date | 2026-04-22 |
| Exit price | Actual exit fill | $138.20 |
| R-multiple result | (Exit − Entry) ÷ Initial R | +1.89R |
| Exit reason | Why you closed | T1 hit, full exit per plan |
| Notes | Post-trade observations | Strong volume breakout day, held cleanly |
The two most critical fields are setup type and R-multiple result. These two columns together reveal which setups are generating repeatable edge and which are producing noise.
For stop placement methodology that feeds into the "Initial R" field, see Swing Trading Stop Loss: 4 Methods That Protect Your Capital.
The R-Multiple: Turning Every Trade Into a Comparable Data Point
The R-multiple expresses any trade's outcome as a multiple of the initial risk. A trade where you risked $500 and made $1,000 is a +2R trade. A trade where you risked $500 and lost $500 is a −1R trade.
Formula: R-multiple = (Exit price − Entry price) ÷ (Entry price − Stop price)
Expressing every trade in R-multiples eliminates the distortion of varying position sizes. A $2,000 gain on a $10,000 position is a +2R trade; a $500 gain on a $2,500 position is also a +2R trade. The two represent identical edge — and your journal treats them identically.
Van Tharp's expectancy formula: Expectancy = (Win Rate × Average Winner in R) − (Loss Rate × Average Loser in R)
An expectancy above 0.3R per trade, sustained over 50 or more trades, indicates a real edge. Below 0.1R suggests the system's edge may be within noise margin — expand the sample before drawing conclusions.
The position sizing calculation that translates your stop distance into a share count is covered in Position Sizing with R-Multiples: Risk Management for Swing Traders.
Journal Metrics That Reveal Hidden Patterns
Four aggregate metrics expose the most common performance leaks. Run these once you have 30 or more closed trades in the journal.
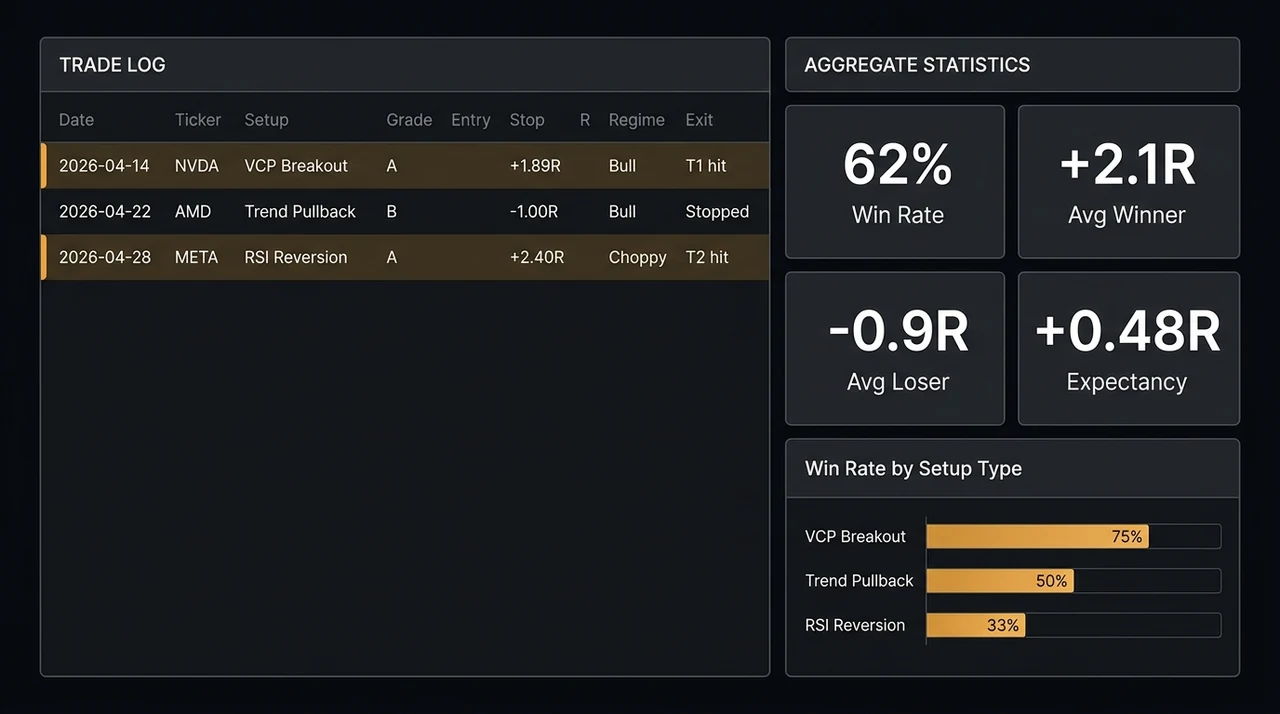
Win rate by setup type. A trader with 50 VCP trades and 50 RSI Reversion trades may find VCP showing 62% win rate and 2.1R average winner, while RSI Reversion shows 45% win rate and 1.4R average winner. The correct response: concentrate capital in VCP trades. This is data, not opinion.
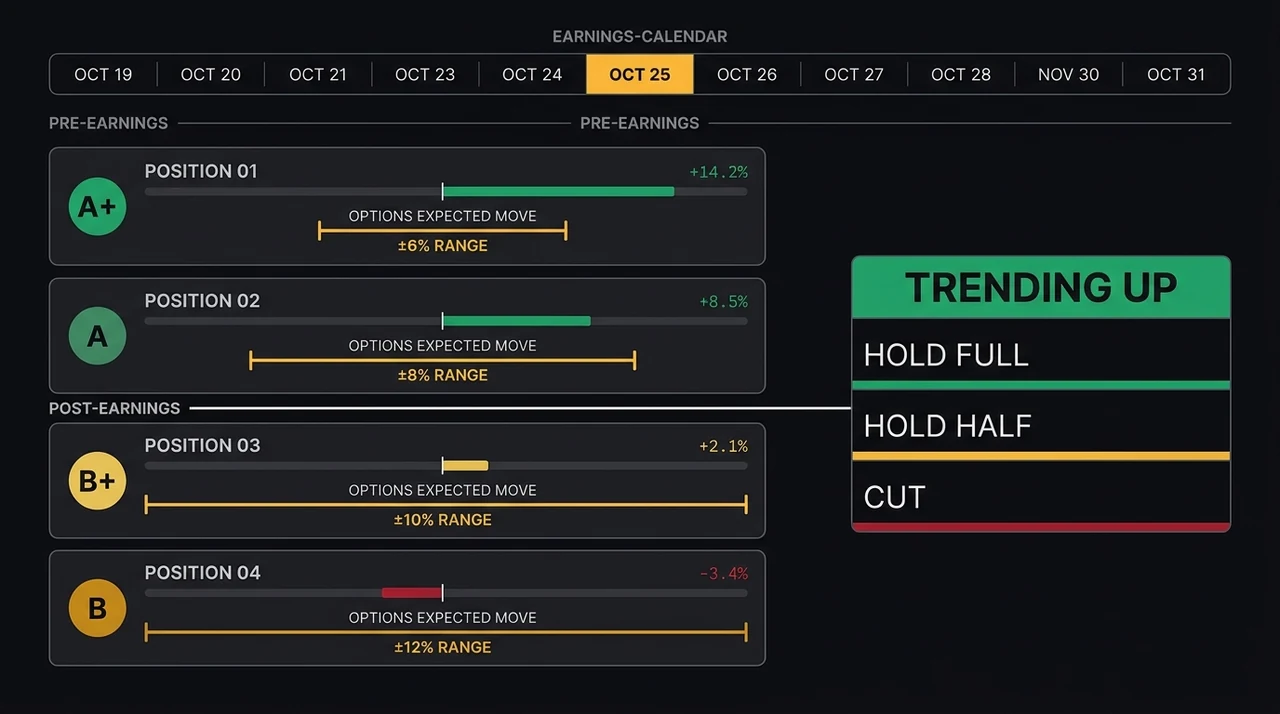
Win rate by market regime. EasySwing gates long setups by regime. Your journal confirms whether your execution respects that gate. If long setups taken during choppy regimes show materially worse win rates, the regime filter is empirically validated in your own data. For regime context, see Market Regime: How to Read Bull, Bear, and Choppy Markets.
Average hold time vs. R-multiple. Many traders exit winners prematurely. Journal data often reveals that trades held beyond 5 days produce substantially better outcomes than those closed in 1–3 days. Your journal is the only place this data exists for your specific execution.
Grade at entry vs. outcome. Do Grade A setups outperform Grade B in your execution? EasySwing's backtest shows higher hit rates for Grade A across the full dataset, but individual execution can differ. If your journal shows Grade B trades producing equivalent or better outcomes, that is a useful signal about your entry timing on Grade A setups — not a refutation of the grading system.
Common Journaling Mistakes That Corrupt the Data
These structural mistakes make journal data useless before the analysis begins.
Logging only the financial outcome, not the decision process. A journal that shows "+1.8R" and nothing else tells you nothing useful. The valuable note is: "Entry was clean, volume confirmation at breakout, stop was 3.2% structural, exited at T1 per plan." That note is what you review on a losing streak to find the difference between good execution and bad.
Not journaling immediately after exit. Memory reconstructs rather than records. Every hour between exit and journal entry adds distortion. The post-trade note has to be written while the chart is still in front of you.
Mixing paper trades with live entries in the same journal. Paper trade data distorts win rates because execution — slippage, fills during volatility, hesitation at entry — does not occur in simulated trades. Keep separate journals or clearly flag simulated entries.
Not reviewing at fixed intervals. Review weekly for individual trade notes; monthly for aggregate metrics (win rate, average R, expectancy by setup). Without scheduled review, the journal becomes an archive rather than a feedback system.
William O'Neil writes in How to Make Money in Stocks (2009): "Keep records. The key to understanding the market and your own system is the systematic record of what happened and why." The systematic part is the review cadence — the record alone is not enough.
How EasySwing Handles the Journal Automatically
EasySwing's built-in journal pre-fills setup type, grade, entry zone, stop level, and target for every detected setup — eliminating the manual data entry step that causes most traders to abandon journaling within the first month.
When you mark a trade cycle as closed, EasySwing calculates the R-multiple, tags the market regime at entry, and adds the trade to your aggregate statistics. The journal dashboard breaks down win rate and average R by setup type and regime, running the four core analyses described above without a spreadsheet.
On every closed trade, Soren — the in-app coach — writes a one-line post-trade note from the trade's own facts (how it exited relative to target, how much heat it took, whether it followed the plan), and you tag the trade against a preset list of common mistakes. The journal then surfaces your most frequent mistakes across all trades, turning the log from a record into a feedback loop.
The thirteen setups EasySwing detects are documented in Swing Trading Strategies: 8 Proven Setups for Every Market. Each strategy page on /strategies includes the setup's historical hit rate, which serves as the baseline expectancy for your personal journal comparison.
Swing Trading Journal Setup Checklist
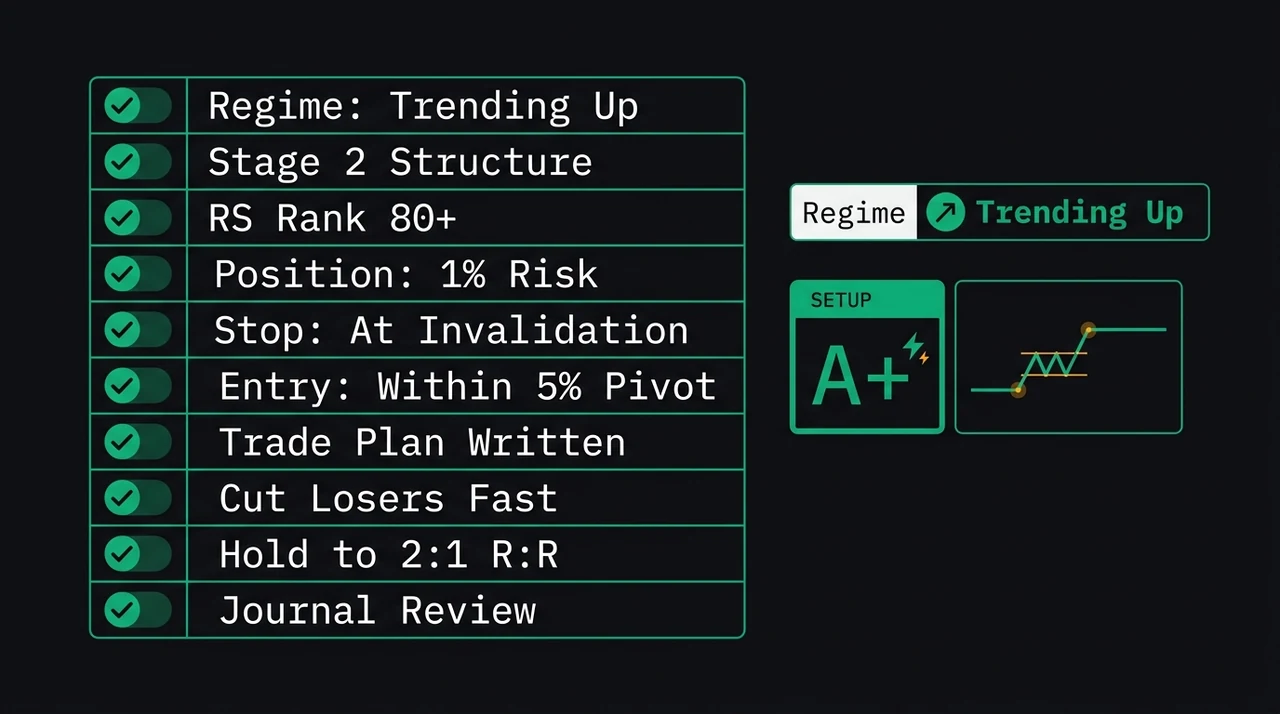
- ✅Journal has fields for: date, ticker, setup type, grade, entry price, stop price, initial R, market regime, exit price, R-multiple, exit reason, post-trade notes
- ✅Every trade is logged the same day — no reconstructed entries
- ✅R-multiple calculated at exit, not at the peak of the move
- ✅Market regime recorded at the time of entry, not retroactively
- ✅Stop level set before entry and recorded before it can be widened
- ✅Monthly aggregate review scheduled: win rate, avg R, expectancy by setup type
- ✅Grade A vs. Grade B split tracked separately from overall win rate
- ✅Regime filter compliance tracked — flag any setup taken against the gate
- ❌Paper trades mixed with live trade data
- ❌"I'll remember this one" substituting for a journal entry
- ❌Journaling resumed only after a losing streak — data gaps corrupt analysis
- ❌Position size omitted — needed to convert R-multiples back to dollar PnL
- ❌Exit reason left blank — "sold" is not a reason; "T1 hit, full exit per plan" is
Frequently Asked Questions
How many trades do I need before journal data is useful?
30 closed trades per setup type is the minimum for meaningful statistics. With fewer, win rate has too wide a confidence interval to act on. At 30 VCP trades you can see whether your VCP execution is working. At 100, the data is reliable enough to make allocation decisions — such as increasing size on that setup or adding a new one.
What is the best format for a swing trading journal?
A spreadsheet with a pivot table on setup type works for most traders starting out. The key requirement is that you can sort by setup type or regime and compute win rate and average R automatically. Dedicated tools remove the manual data entry step — EasySwing's journal logs setup type, grade, entry, stop, and target at detection and calculates R-multiples at close.
Should I include commissions in my R-multiple calculation?
Yes, once commissions are material relative to position size. On accounts under $10,000, round-trip commission on a 200-share position can represent 0.05–0.1R and becomes relevant to expectancy. On accounts above $25,000, commission impact is negligible for most brokers. The cleanest approach is to include commissions in the exit price used for R-multiple calculation from the start.
How do I use journal data to improve my setup selection?
Compute win rate and average R broken down by setup type across your last 50 closed trades. Rank setups by expectancy (win rate × avg winner − loss rate × avg loser). Reduce or eliminate any setup showing negative expectancy across 30 or more trades. Increase exposure to the highest-expectancy setups that also match the current market regime — both conditions together, not either alone.
What should I do when my journal shows I am consistently losing on a specific setup?
First, check whether those trades were taken in the right market regime. Long momentum setups taken in a Bear regime will show poor results regardless of setup quality. If regime was correct and the setup still shows persistent negative expectancy across 30 or more trades, reduce position size on that setup and review entry timing — are you entering at the pivot, or late into the move? Barber and Odean (Journal of Finance, 2000) found that timing of execution, not setup selection, accounts for a substantial portion of the performance gap between active traders.
EasySwing.trading automatically logs each detected setup's grade, entry zone, stop level, and target to your trade journal — eliminating the manual data entry step that derails most journaling attempts. Use Position Sizing with R-Multiples and Swing Trading Stop Loss as companion reading to complete your pre-trade plan before opening a position. Scan results are for informational purposes only. See our Risk Disclaimer.
Disclaimer: This article is for educational purposes only and does not constitute investment advice. EasySwing is a stock screening tool, not a registered investment advisor. All trading involves risk. Read our full disclaimer →