MACD for Swing Trading: How to Read Momentum Shifts and Filter False Crossovers
Gerald Appel built the MACD in 1979 to solve one problem: ordinary moving-average crossovers fired entries weeks after a trend had already turned. His fix was to subtract one EMA from another, smooth that line, then plot the gap between them as bars. The bars — the histogram — tell you the rate of change of momentum, not just its direction. The histogram is the part that matters. The crossover is the part everyone watches.
That mismatch is why MACD is one of the most-installed indicators in retail charting software and one of the most reliably misread. Used correctly, it confirms whether a Stage 2 stock is re-accelerating after a pullback, often two to four bars before the line-crossing signal catches up. Used badly, it generates a steady stream of false starts in choppy markets.
What MACD Actually Measures
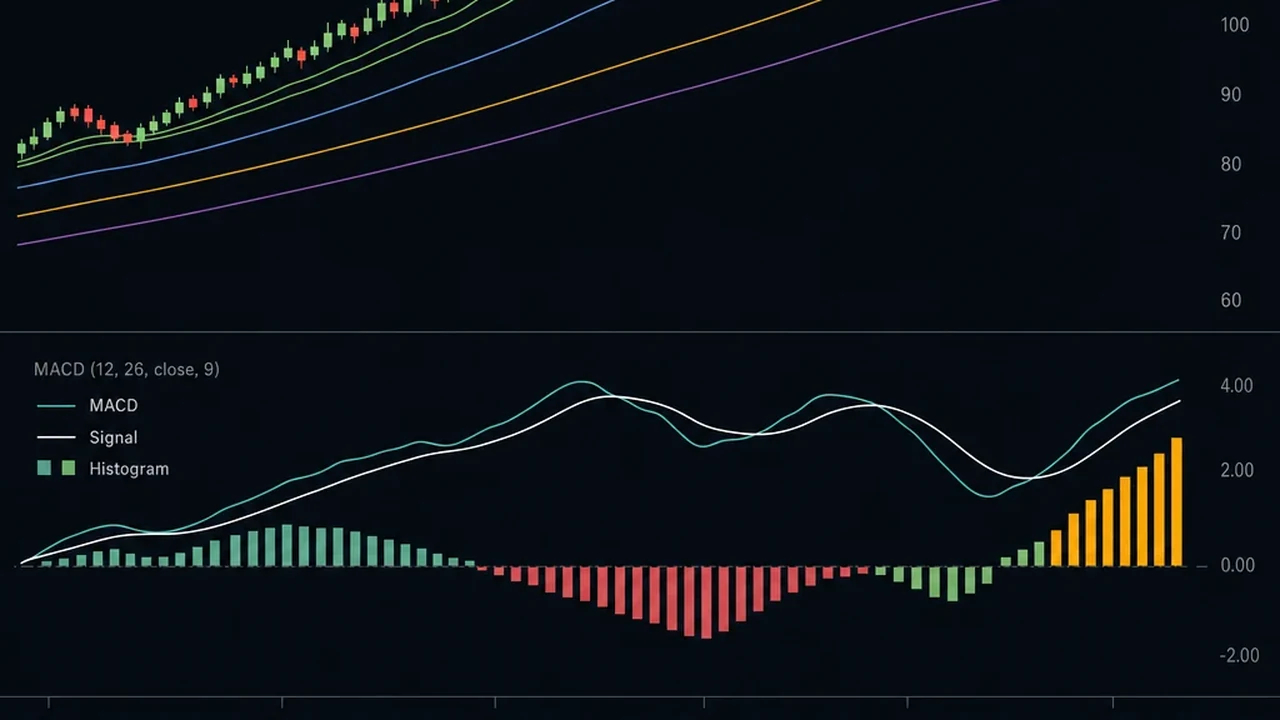
MACD is the distance between a 12-day EMA and a 26-day EMA. When the 12-day sits above the 26-day, MACD is positive; when below, negative. The number itself isn't the signal — its direction of change is. A widening gap means short-term momentum is pulling ahead of the intermediate trend; a narrowing gap means it's giving back ground. The zero line is just where the two timeframes agree, not a trade trigger.
Appel picked 12 and 26 because they map roughly to 2.5 weeks and 5 weeks of trading — short enough to react to swings, long enough to ignore single-day noise. The 9-day signal line smooths the MACD, and the histogram (MACD minus signal) plots the gap between them. That last piece is the most forward-looking part of the indicator. It turns before the crossover fires.
The Three MACD Components
Most charts show MACD as a single block. It isn't. It's three signals at three different time resolutions, and treating them interchangeably produces contradictory reads.
| Component | Formula | What it tells you |
|---|---|---|
| MACD Line | 12-day EMA − 26-day EMA | Where short-term momentum sits vs. the intermediate trend |
| Signal Line | 9-day EMA of MACD Line | A lagging reference — useful only for crossover detection |
| Histogram | MACD Line − Signal Line | Direction and speed of momentum, right now |
The MACD line tells you the current condition. The signal line tells you what MACD looked like nine days ago. The histogram tells you which way momentum is heading — and how fast.
Appel put it plainly in Technical Analysis: Power Tools for Active Investors (2005): "The histogram provides information that the MACD line itself does not — specifically, the rate of change of MACD. It leads the crossover by several bars in most trending markets." It's the component most retail traders ignore. It's also the one that gives the earliest read.
MACD Crossovers: Where Traders Go Wrong
A MACD crossover — line through signal — is the most-cited MACD signal and, used alone, the noisiest.
In a trending Stage 2 stock, crossovers add value. A positive MACD line above its signal confirms the trend is intact, and a re-cross after a pullback confirms it's resumed. In a choppy market, the same crossover keeps flipping with no follow-through. The signal line is a 9-day average of a momentum differential — in a stock oscillating sideways, that average inverts every couple of weeks for no real reason.
The zero-line crossover suffers from the same lag, just amplified. By the time the 12-day EMA crosses through the 26-day, the move that drove it is usually already 4–7% old. In most confirmed Stage 2 breakouts, the zero-line crossover prints after the initial thrust, not at the buyable pivot.
Use crossovers as trend context. Don't use them to time entries.
Histogram Momentum: The Signal That Leads
The histogram changes direction before the MACD line crosses its signal. That two-to-four-bar lead is the most tactically useful piece of MACD for swing traders, because it confirms momentum re-acceleration before the lagging crossover catches up.
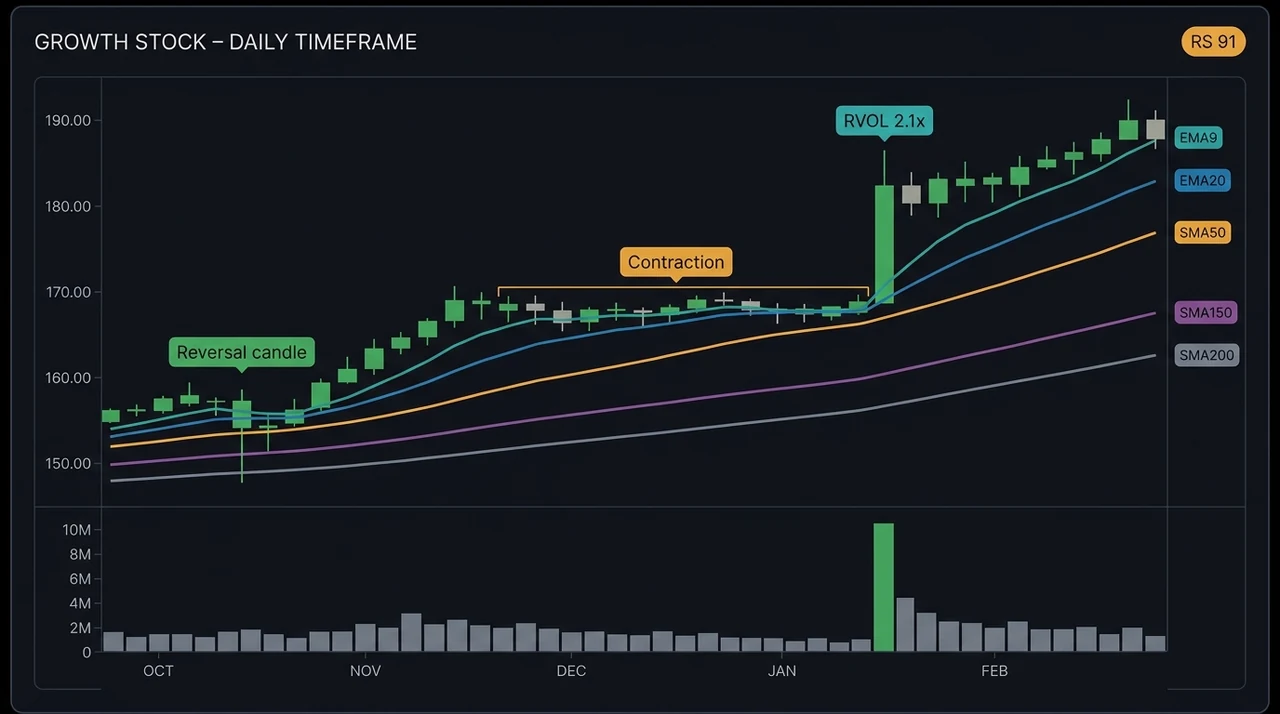
For pullback entries, the histogram gives you an early re-entry trigger. Picture a Stage 2 stock pulling back to its EMA20: volume contracts, the MACD line is still positive but rolling over, and the histogram bars are shrinking toward zero. When the histogram bottoms and starts to expand again, the pullback is ending — often a bar or two before price even takes out the local high. That's a lower-risk entry than waiting for the new-high confirmation.
For base setups, the histogram is a tell on pattern quality. A stock building a VCP shows shrinking histogram bars through each successive contraction — each pullback hits a smaller absolute histogram low than the prior one. That's the right momentum signature for a tightening base: sellers losing force on each swing. When the histogram reverses from its final low and expands, the breakout has momentum behind it, not just price action.
The moving average stack defines the trend's shape. The histogram tells you whether the trend's energy is building or fading inside that shape — before the price action makes it obvious.
MACD Divergence as a Setup Quality Filter
Divergence is when price and the histogram disagree. Price prints a new low while the histogram prints a higher low, or price prints a new high while the histogram prints a lower high. It's not an entry signal on its own — it's a quality filter, a condition that shifts the odds on a trade direction worth taking.
Bullish divergence: price lower low, histogram higher low. Sellers pushed price down, but with less force than the prior leg. That adds conviction to a mean-reversion bounce setup — two independent momentum measures both saying sellers are running out, rather than one.
Bearish divergence: price higher high, histogram lower high. Buyers got price to a new high on less momentum than the last push. Mark Minervini described the underlying condition in Think and Trade Like a Champion (2017): "The telltale sign that the big money is selling into strength is that price moves higher on declining momentum — volume is lighter, breadth narrower, and the advance looks tired even as it reaches new highs." The histogram makes that fatigue quantifiable before it shows up in the tape.
Confirm divergence across at least two clean pivots 8–15 trading days apart. One dip during an uptrend is noise. Two pivots where the histogram keeps failing to match the prior extreme is a real divergence worth factoring into how you manage the position.
Stage and Regime Context for MACD
MACD signals are regime-dependent. In a Trending Up market, individual-stock momentum is reinforced by the macro tape, and false crossovers thin out. In a Choppy regime, the same MACD pattern produces more whipsaws — macro headwinds interrupt setups before they complete.
Market regime has to be confirmed before any MACD signal counts. A histogram re-acceleration on a Stage 2 stock during a Trending Up tape has materially higher follow-through odds than the same histogram pattern in the same stock during a Choppy or Trending Down one. The indicator is identical — the environment behind it isn't.
Stage 2 is a pre-filter, not a secondary check. A stock with positive MACD sitting below its SMA200 is in a categorically different setup than a Stage 2 stock with the same reading. Order matters: Stage 2 alignment plus regime context establish the gate; MACD is the timing confirmation inside that gate. Running MACD first and hoping Stage 2 lines up is the reversed sequence that produces most false entries.
For the full framework that situates MACD alongside the MA stack, RS rank, and pattern detection, see Swing Trading Technical Analysis: A Practitioner's Framework.
The MACD Swing Trading Checklist
Before using MACD as a timing input on a swing trade:
- ✅Stock is in Stage 2 — price above EMA20, SMA50, SMA150, SMA200, all rising
- ✅Market regime is Trending Up or Neutral (not Choppy or Trending Down)
- ✅MACD line is positive — short-term momentum above intermediate trend
- ✅Histogram is expanding upward — momentum accelerating, not just present
- ✅For pullback entries: histogram contracted through the pullback and is re-expanding now
- ✅No bearish histogram divergence — histogram isn't making lower highs while price prints new highs
- ✅Volume expands on breakout days, contracts on consolidation days
- ❌Don't use crossovers alone in choppy or ranging markets
- ❌Don't lean on the zero-line crossover as a primary entry trigger — it fires after the move's started
- ❌Don't ignore bearish histogram divergence in active long positions
- ❌Don't run MACD without confirming Stage 2 and regime first
- ❌Don't shorten MACD below 12/26/9 for standard 2–30 day swing holds
How EasySwing.trading Uses Momentum Analysis
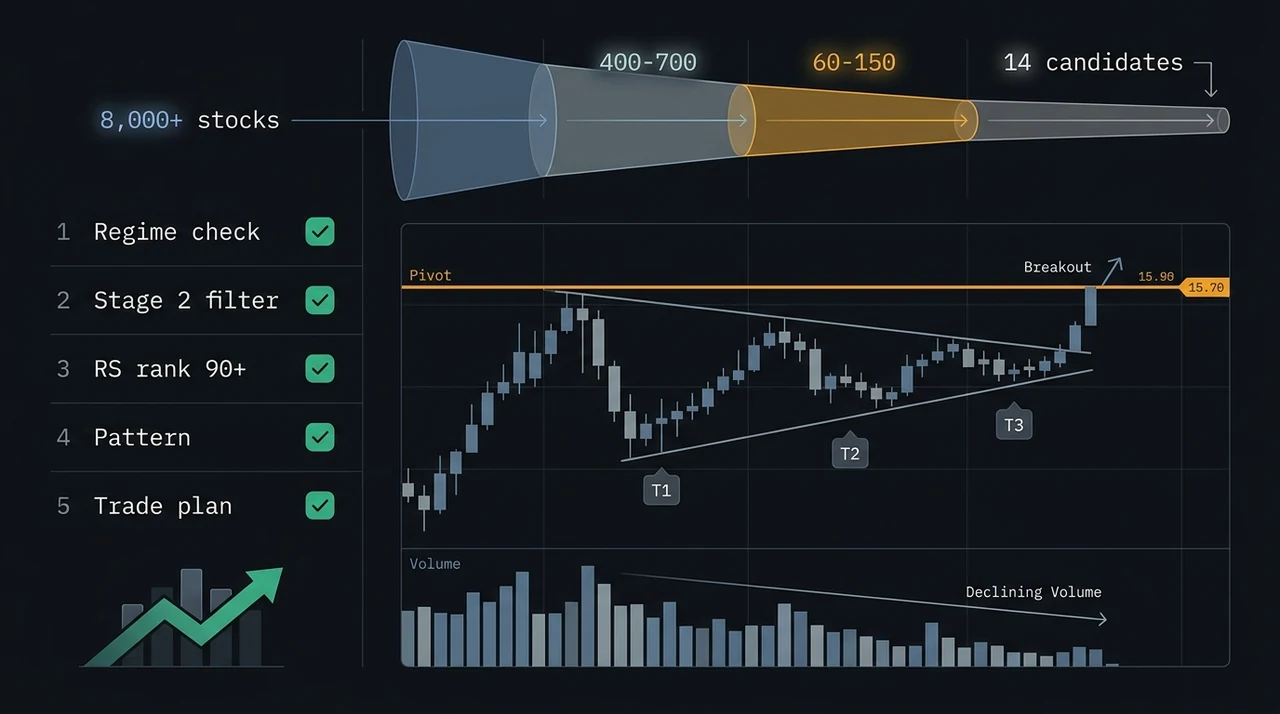
EasySwing.trading treats momentum as one layer inside the grading framework, not as a standalone signal. For Trend Pullback setups, the engine checks that the stock's momentum profile is consistent with a re-entry: relative strength stays high, the Stage 2 structure is intact, and the volume signature during the pullback looks like institutional accumulation rather than distribution. Those are the same conditions a clean histogram re-expansion identifies — applied systematically across 2,000+ US stocks and combined with regime, RS rank, and pattern detection into a single A+/A/B+/B/C grade.
An A-grade pullback setup already reflects momentum re-acceleration. The histogram signal is baked into the grade — it's not something you have to read off the chart manually.
For the broader indicator stack MACD operates inside, see Best Indicators for Swing Trading: The 5 That Actually Work. And for the Bollinger Bands squeeze framework that catches the same pre-breakout volatility contraction from a different angle, the two reads are often strongest in combination.
Frequently Asked Questions
What are the best MACD settings for swing trading?
Stick with 12, 26, 9. They're built for daily-chart swing trading on 2–30 day holds — Appel chose them to capture roughly 2.5 weeks and 5 weeks of trading activity. Shorter values (8, 17, 9) give more signals but lower quality; longer values (19, 39, 9) smooth out noise but lag badly at entry. For most swing traders, the defaults are the right starting point.
What does a positive MACD mean?
A positive MACD just means the 12-day EMA sits above the 26-day EMA — short-term momentum is running ahead of the intermediate trend. Average prices over the past 12 days are higher than over the past 26 days, so buyers have been in control across both windows. In a Stage 2 uptrend that's the normal state. It confirms trend alignment, but it doesn't tell you anything about the size or sustainability of the next move.
How do I identify MACD divergence?
Compare two consecutive price pivots against two corresponding histogram pivots. Bullish: price lower low, histogram higher low. Bearish: price higher high, histogram lower high. Wait for at least two clean pivots, 8–15 trading days apart. A single-bar disagreement during a trend is noise. Confirmed divergence shifts the odds on a trade direction — it doesn't on its own generate an entry or an exit.
Can MACD work alone as a swing trading entry system?
No. Crossovers throw too many false signals in choppy or ranging tape to be viable as a standalone system. MACD gives its highest-quality signal as timing confirmation inside a framework: Stage 2 trend in place, regime Trending Up or Neutral, RS rank above 80, and a named pattern (VCP, pullback, cup-and-handle) on the chart. Inside that frame, MACD confirms whether the underlying momentum is lined up with the setup direction at the bar level.
How is MACD different from RSI for swing trading?
MACD measures the distance between two EMAs — a trend-based momentum read that tells you whether short-term momentum is pulling ahead of the intermediate trend and whether that gap is opening or closing. RSI measures the ratio of recent gains to recent losses on a 0–100 scale, flagging overbought and oversold conditions relative to recent price history. MACD is better for confirming trend momentum and spotting divergence in trending stocks. RSI is better for timing mean-reversion entries when a stock has pulled back into an oversold zone. Together they read momentum from two independent angles.
EasySwing.trading automatically applies Stage 2 trend filters, regime gates, and RS rank thresholds across 2,000+ US stocks before any momentum condition counts toward a setup grade — every candidate in scan results has already cleared the trend and regime pre-filters. For the full indicator framework, see Best Indicators for Swing Trading and Swing Trading Technical Analysis: A Practitioner's Framework. Scan results are for informational purposes only. See our Risk Disclaimer.
Disclaimer: This article is for educational purposes only and does not constitute investment advice. EasySwing is a stock screening tool, not a registered investment advisor. All trading involves risk. Read our full disclaimer →