Bollinger Bands in Swing Trading: Reading the Squeeze
John Bollinger introduced Bollinger Bands in the early 1980s to solve a problem percentage envelopes couldn't: fixed-width channels ignored the fact that volatility is never constant. His solution -- bands set 2 standard deviations from a 20-period moving average -- dynamically widen in volatile markets and narrow in quiet ones. According to Bollinger on Bollinger Bands (2002), the standard settings contain approximately 89% of price action. The 11% that escapes those bands is where swing trades are made.
Short answer: A Bollinger Band squeeze occurs when the upper and lower bands compress to their narrowest reading in 6 months, signaling a stock is coiling before a directional expansion. Swing traders wait for a close above the upper band on high volume -- in a Stage 2 stock with RS rank above 80 -- then set a stop below the lower band or the most recent structure low.
The Anatomy of Bollinger Bands
Bollinger Bands consist of three lines around a stock's price: a 20-period simple moving average (SMA) as the middle band, with upper and lower bands set 2 standard deviations above and below it. As price volatility rises, the bands widen. As volatility falls, they narrow. This dynamic adjustment is what separates Bollinger Bands from fixed-percentage envelopes.
Two companion indicators complete the framework:
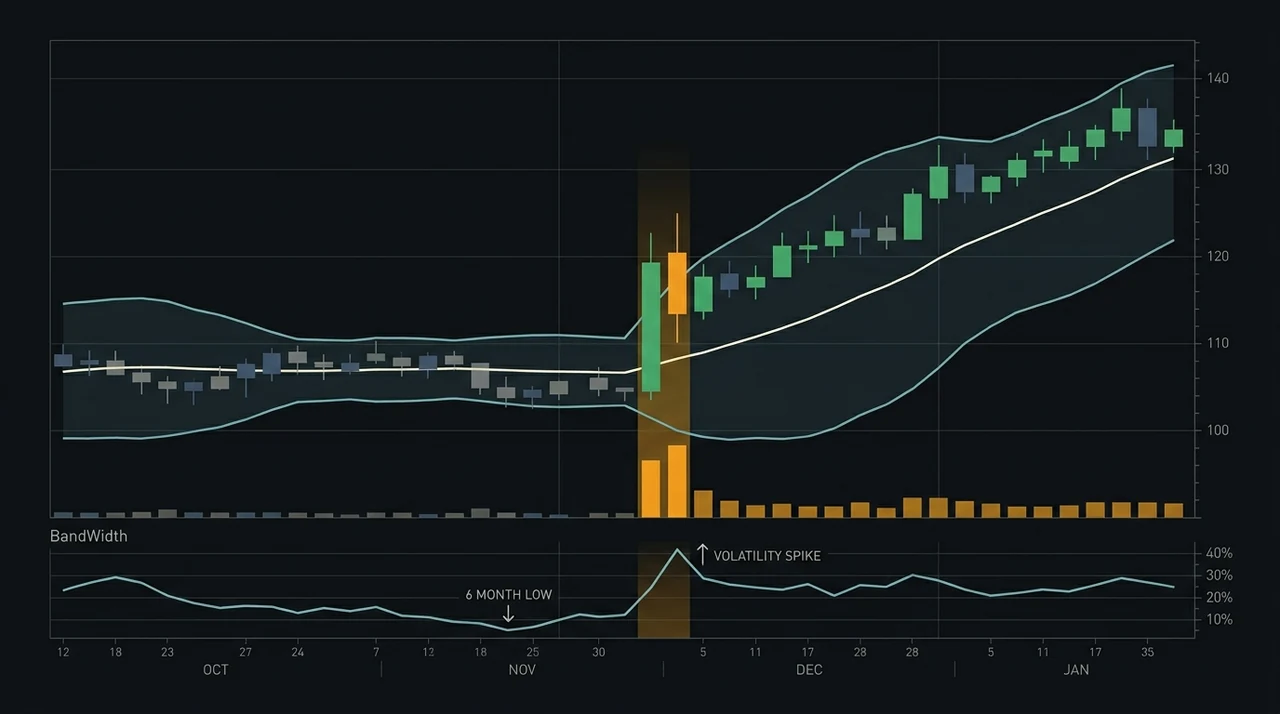
- BandWidth: The distance between the upper and lower bands as a percentage of the middle band. A 6-month low in BandWidth identifies the squeeze -- the precondition most swing traders target.
- %B: Where price sits within the bands on a 0--1 scale. A reading above 1 means price has closed above the upper band; below 0 means it has closed below the lower band. Sustained %B above 0.8 in a trending stock confirms upside momentum.
Under a standard normal distribution, a 2-standard-deviation band would contain 95.4% of data. In actual equity markets -- where fat tails and asymmetric return distributions are the rule -- the containment is lower. That departure from normal distribution is what makes breakouts outside the bands carry real information.
The Bollinger Band Squeeze
The squeeze is the narrowest BandWidth reading over a rolling 6-month window. When volatility contracts to a multi-month low, the stock is coiling -- building directional pressure before an expansion. John Bollinger calls this "the calm before the storm." The squeeze does not predict direction; it predicts that a significant move is imminent. Context determines whether that move will be bullish or bearish.
This is the same principle underlying the Volatility Contraction Pattern (VCP): successively smaller price swings on declining volume before a breakout. The VCP describes the contraction qualitatively by chart structure. Bollinger Bands quantify the same contraction mathematically, using standard deviation. Both capture what is happening in the market: a stock being absorbed by institutional buyers before a high-volume breakout.
Mark Minervini writes in Trade Like a Stock Market Wizard (2013): "The tighter the contraction, the more powerful the subsequent expansion." That observation maps directly onto Bollinger Band behavior. A tighter squeeze -- lower BandWidth, longer duration -- historically resolves into a sharper directional expansion.
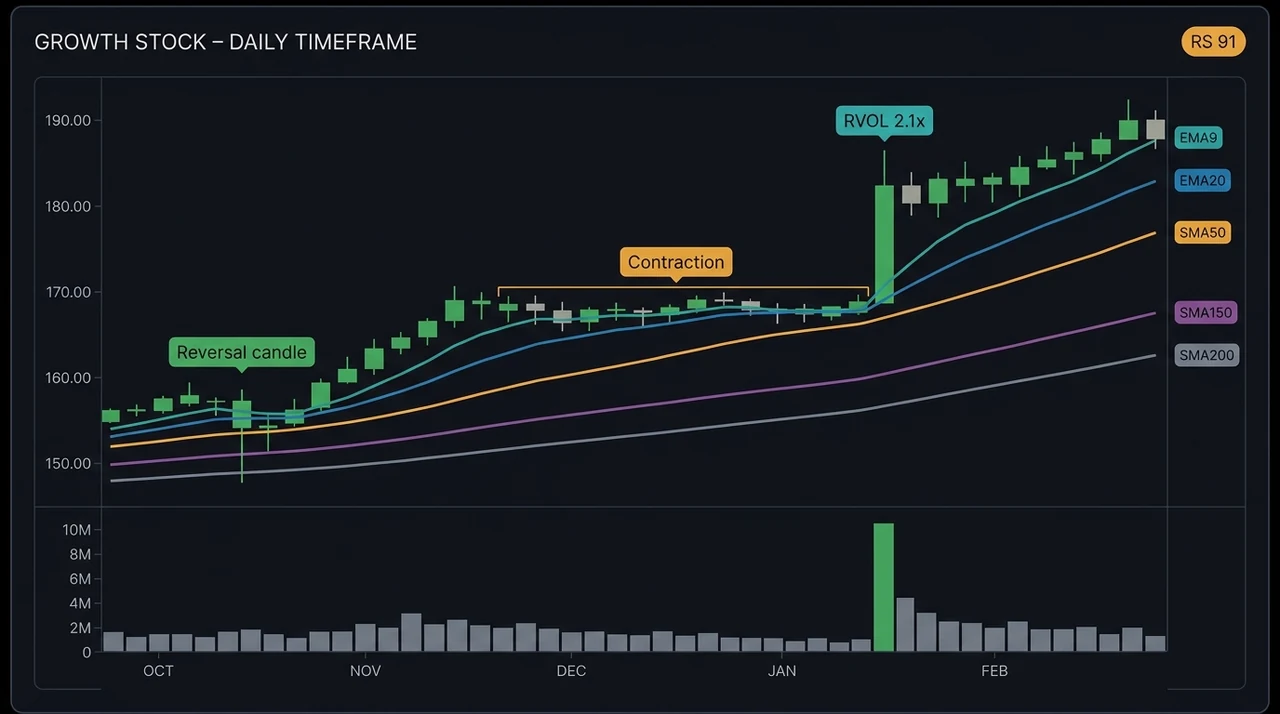
In a Stage 2 uptrend (price above a rising moving average stack: 50-day MA > 150-day MA > 200-day MA), squeezes that resolve to the upside on high volume produce the most reliable swing entries. In a Stage 4 downtrend, the same squeeze structure resolving to the downside sets up short entries. The Stage 2 filter removes the majority of false bullish breakouts.
Lo, Mamaysky, and Wang's "Foundations of Technical Analysis" (Journal of Finance, 2000) demonstrated that breakout patterns following low-volatility consolidations produced statistically significant excess returns across US equities from 1962--1996 -- providing academic grounding for what practitioners observe empirically with the Bollinger Band squeeze.
How to Trade Bollinger Band Breakouts
A valid Bollinger Band breakout trade requires three components before entry.
A confirmed squeeze. BandWidth at or near a 6-month low. Volume has been drying up inside the base -- below the 50-day average on down-days. Upper and lower bands are converging. This is the coiling phase.
The expansion trigger. A close above the upper Bollinger Band on volume at least 1.5 times the 50-day average. One day of above-average volume is a starting signal; look for the expansion to hold on day 2 and 3, with the bands beginning to widen and BandWidth rising from its low.
Trend and relative strength context. The stock is in Stage 2, RS rank is above 80 (ideally above 90), and the market regime is Trending Up or Neutral. A Bollinger breakout in a Choppy or Bear regime has a materially lower follow-through rate.
The stop loss goes below the lower Bollinger Band at the time of entry, or below the lowest intraday low within the squeeze -- whichever is tighter. That level is the structural invalidation of the setup. For the full stop placement framework across four methods, see Swing Trading Stop Loss: 4 Methods That Protect Your Capital.
| Component | Requirement | Why It Matters |
|---|---|---|
| BandWidth | 6-month low | Confirms volatility contraction |
| Stage 2 | Price > 50-day > 150-day > 200-day MA | Institutional trend confirmed |
| RS Rank | ≥ 80 (ideally ≥ 90) | Stock outperforming the market |
| Breakout close | Above upper band | Volatility expanding directionally |
| Volume | ≥ 1.5× 50-day average | Institutional participation |
| Stop | Below lower band or squeeze low | Structural invalidation point |
| Regime | Trending Up or Neutral | Reduces false breakout rate |
Bollinger Bands and the VCP Connection
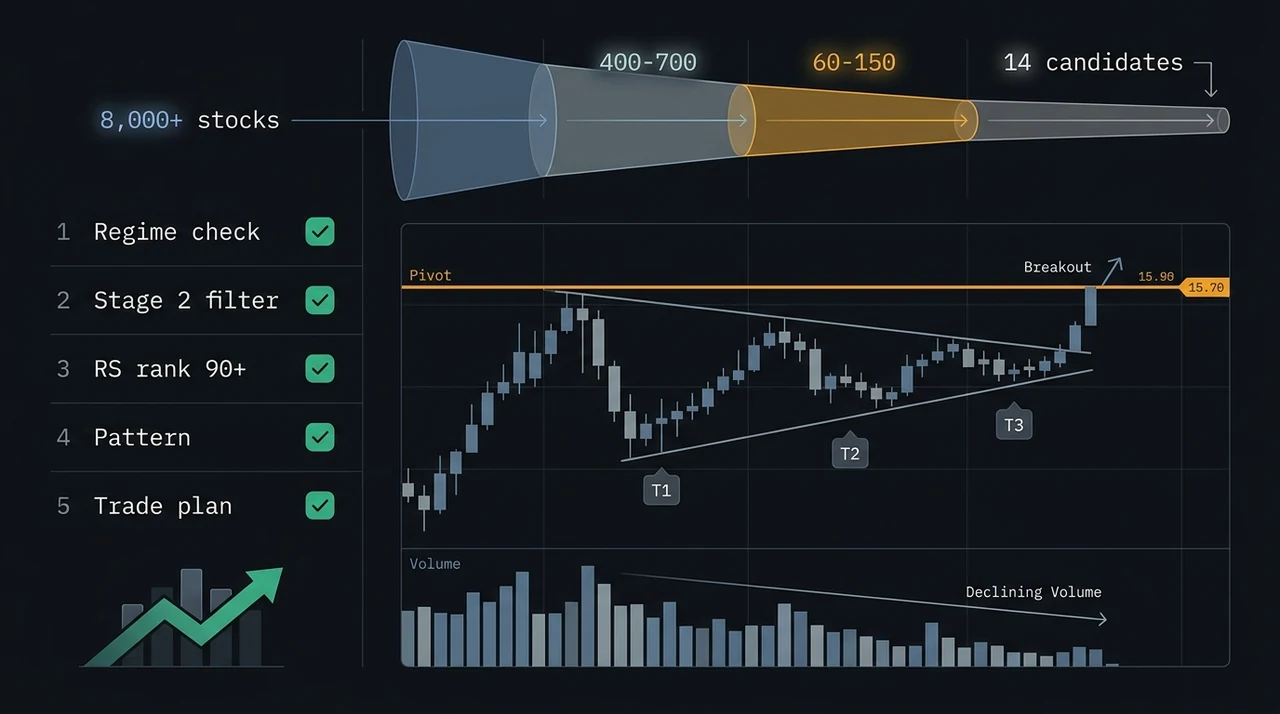
Bollinger Band squeezes and VCP setups describe the same underlying volatility contraction from two different angles. The VCP identifies contraction depth by measuring the height of each successive pullback (T1, T2, T3) relative to the prior swing. Bollinger Bands measure the same contraction with standard deviation math. When both are present simultaneously, two independent indicators confirm the same pre-breakout condition.
The strongest VCP formations -- three or more clean contractions with volume dry-up -- almost always show a simultaneous Bollinger Band squeeze. The T3 contraction of a VCP typically coincides with the tightest BandWidth reading before the breakout pivot. When a trader can see both the VCP structure and the Bollinger squeeze on the same chart, the setup quality is reinforced by both frameworks.
EasySwing's VCP detection quantifies contraction depth and volume dry-up systematically, producing a setup grade (A+/A/B+/B/C) that captures the same signal Bollinger Band squeezes identify visually. For the broader framework connecting VCP, Bollinger Bands, moving average stacks, and RS rank, see Swing Trading Technical Analysis: A Practitioner's Framework.
Common Bollinger Band Mistakes
Shorting every upper band touch. The most common error with Bollinger Bands. In a Stage 2 uptrend, price touching or closing above the upper band is a sign of strength -- not an overextension signal. Strong trending stocks "walk the upper band," with %B sustained above 0.8 for weeks at a time. Fading every upper-band touch in a bull market loses money systematically.
Buying every lower band touch. The same error in a downtrend. The lower band gets hit repeatedly as a declining stock falls. A lower-band touch in a Stage 4 stock is a continuation signal, not a support bounce.
Ignoring regime context. Bollinger Band breakouts produce the highest follow-through rates in a Trending Up market regime. In Choppy or Bear regimes, false breakouts -- closes above the upper band that fail to sustain -- are materially more frequent. EasySwing gates every setup by the current market environment for exactly this reason.
Skipping volume confirmation. A close above the upper Bollinger Band on below-average volume is almost always a false breakout. Institutional buying generates volume. Without it, the price move is likely short-covering or thin retail momentum that won't hold.
Bollinger Band Swing Trading Checklist
- ✅ BandWidth at or near 6-month low (confirmed squeeze)
- ✅ Stock in Stage 2 uptrend (price > 50-day MA > 150-day MA > 200-day MA)
- ✅ RS rank ≥ 80 (ideally ≥ 90)
- ✅ Volume drying up inside the squeeze (below 50-day average)
- ✅ Close above upper band on ≥ 1.5× 50-day volume
- ✅ Stop placed below lower band or most recent squeeze low
- ✅ Market regime: Trending Up or Neutral
- ❌ Fading upper band touches in a trending stock
- ❌ Buying breakouts without volume confirmation
- ❌ Entering squeeze breakouts in Stage 3 or Stage 4 stocks
- ❌ Moving the stop lower after the breakout (hold the original level)
Frequently Asked Questions
What is a Bollinger Band squeeze?
A Bollinger Band squeeze occurs when the upper and lower bands narrow to their tightest reading over a rolling 6-month window. It signals that price volatility has contracted to a multi-month low -- a condition that historically precedes a significant directional expansion. The BandWidth indicator quantifies the squeeze. Swing traders use it as a precondition for a breakout trade rather than as an entry trigger by itself.
What are the best Bollinger Band settings for swing trading?
The standard settings -- 20-period SMA, 2 standard deviations -- are appropriate for daily swing trading charts covering holding periods of 2--30 days. John Bollinger (Bollinger on Bollinger Bands, 2002) recommends adjusting the period and standard deviation together: a shorter period (10) works with a narrower deviation (1.5); a longer period (50) requires a wider one (2.5). For most swing traders, the default 20/2 settings are the right starting point.
How do Bollinger Bands differ from Keltner Channels?
Both are volatility-based channel indicators, but they measure volatility differently. Bollinger Bands use standard deviation of price, which responds sharply to large price moves. Keltner Channels use Average True Range (ATR), which produces smoother, more stable bands. Many traders use both together: when Bollinger Bands contract inside Keltner Channels -- the "BB inside KC" squeeze -- both measures of volatility are compressed simultaneously, producing a stronger setup signal than either indicator alone.
Can Bollinger Bands be used as the only swing trading indicator?
No -- and John Bollinger cautions against this in Bollinger on Bollinger Bands (2002). He describes the bands as a "relative definition of high and low" that requires confirmation from other indicators to generate a usable signal. Used alone, the squeeze gives no directional bias and no trend context. Combined with Stage 2 analysis, RS rank, volume confirmation, and a market regime filter, the squeeze becomes one component of a systematic, higher-probability framework.
Does EasySwing screen for Bollinger Band squeezes?
EasySwing screens for the underlying volatility contraction that produces Bollinger squeezes -- through VCP pattern detection, which measures contraction depth and volume dry-up systematically across 2,000+ US stocks. The result captures the same pre-breakout condition that a Bollinger squeeze identifies, inside a framework that adds regime gating, RS rank filtering, and pre-calculated entry, stop, and target levels. The VCP setup grade (A+/A/B+/B/C) summarizes the overall quality of the volatility contraction.
EasySwing.trading screens for volatility contraction patterns -- the same conditions that produce Bollinger Band squeezes -- across 2,000+ US stocks each trading day. For more on the underlying pattern, read the VCP setup guide. For the full technical analysis framework, see Swing Trading Technical Analysis: A Practitioner's Framework. Scan results are for informational purposes only. See our Risk Disclaimer.
Disclaimer: This article is for educational purposes only and does not constitute investment advice. EasySwing is a stock screening tool, not a registered investment advisor. All trading involves risk. Read our full disclaimer →