Volume Analysis for Swing Trading: How RVOL Separates Real Breakouts from Traps
William O'Neil studied over 400 of the greatest stock market winners in U.S. history and found that 95% of them showed volume at least 40–50% above their daily average on the initial breakout day (How to Make Money in Stocks, 2009). Volume is not a secondary indicator. It is the force that separates a real breakout from a false one — before price action makes the distinction obvious.
Most traders look at price first and volume as an afterthought. That's the wrong sequence. Price tells you where supply and demand last equilibrated. Volume tells you how many shares changed hands to get there — and whether the move reflects genuine conviction or a temporary absence of the other side. When a stock clears a pivot on thin volume, sellers stepped away; they weren't beaten. When the same move happens on 2× the 20-day average, institutions are actively absorbing whatever sellers remain. That difference — conviction vs. vacuum — is what determines whether a breakout holds or reverses into a trap.
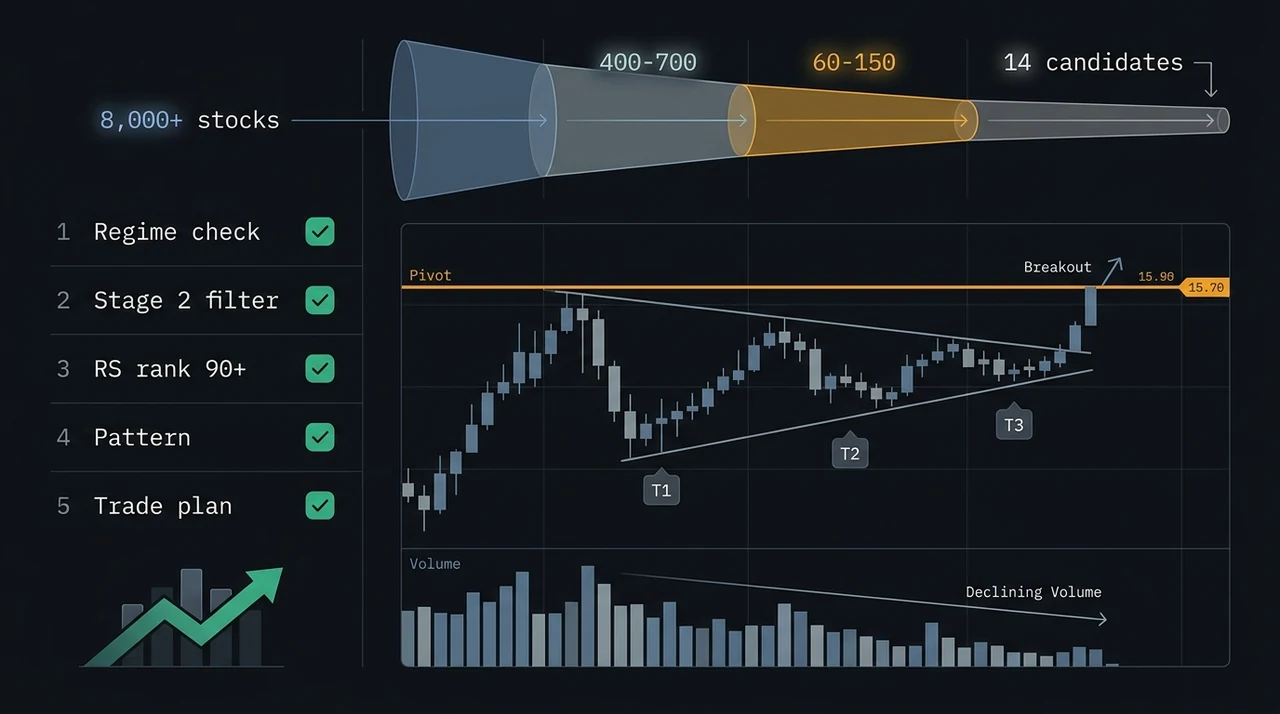
This guide covers the one volume metric that matters for swing trading, what volume should look like during breakouts and bases, and how EasySwing.trading integrates volume criteria into setup grading across 2,000+ US stocks.
What Volume Actually Tells You in a Swing Trading Context
Raw share volume is meaningless in isolation. A stock trading 800,000 shares on a given session could be running at twice its normal pace or barely half, depending on its typical daily turnover. The number means nothing without a baseline.
Relative volume (RVOL) is the only volume figure worth analyzing for swing trading. RVOL is today's volume divided by the stock's average daily volume over a reference period — typically 14 or 20 trading days. A reading of 1.0 means exactly average. A reading of 1.5 means 50% above the baseline. A reading of 0.6 means the stock is trading at barely more than half its normal pace.
Price and volume tell opposite sides of the same story. Price shows the result of the latest supply-demand negotiation. Volume shows how aggressively each side was pressing. A price advance on rising RVOL tells you buyers were committed enough to absorb selling. The same advance on declining RVOL tells you price moved because sellers were absent — not because buyers overwhelmed them. That distinction matters enormously for follow-through.
Mark Minervini described the mechanics in Trade Like a Stock Market Wizard (2013): "Volume is the fuel that powers the price move. Without volume expansion, there's no evidence of institutional involvement, and without institutions, most breakouts stall or reverse within days." A stock can have flawless technical structure — right stage, right pattern, right relative strength — and still produce a losing trade if volume fails to confirm at the moment of entry.
Relative Volume Thresholds That Matter
The RVOL scale isn't linear in its trading implications. Different readings belong to different phases of a setup.
| RVOL | Phase and interpretation |
|---|---|
| 0.3–0.6 | Healthy consolidation — ideal for down days inside a base |
| 0.7–0.9 | Below average — watch-only zone; no directional confirmation |
| 1.0–1.2 | Roughly average — normal participation, neither confirming nor denying |
| 1.3–1.5 | Above average — buyers lifting activity, valid support for pullback entries |
| 1.5–2.5 | Strong confirmation — institutional-level interest; breakouts here hold most often |
| 2.5+ | Very high — may reflect a one-time event (earnings, news); different analysis applies |
For breakout entries, the bar is 1.5× or above — directly matching O'Neil's 40–50% threshold. For pullback re-entries in a trending Stage 2 stock, 1.2–1.3× is sufficient: you're not asking for breakout conviction, just confirmation that buyers are showing up at the re-entry level.
Volume During Breakouts: Three Patterns That Count
A breakout is only as valid as the volume behind it. Three patterns dominate:
1. Volume expansion on the breakout day itself. The textbook case: a stock clears a pivot resistance on 1.5× or more of its 20-day average. The surge shows that buyers overwhelmed the sellers who had been capping price at that level. In O'Neil's 400-winner database, this single characteristic appeared in 9 out of 10 significant moves. Without it, price cleared because sellers temporarily stepped aside — not because demand genuinely exceeded supply.
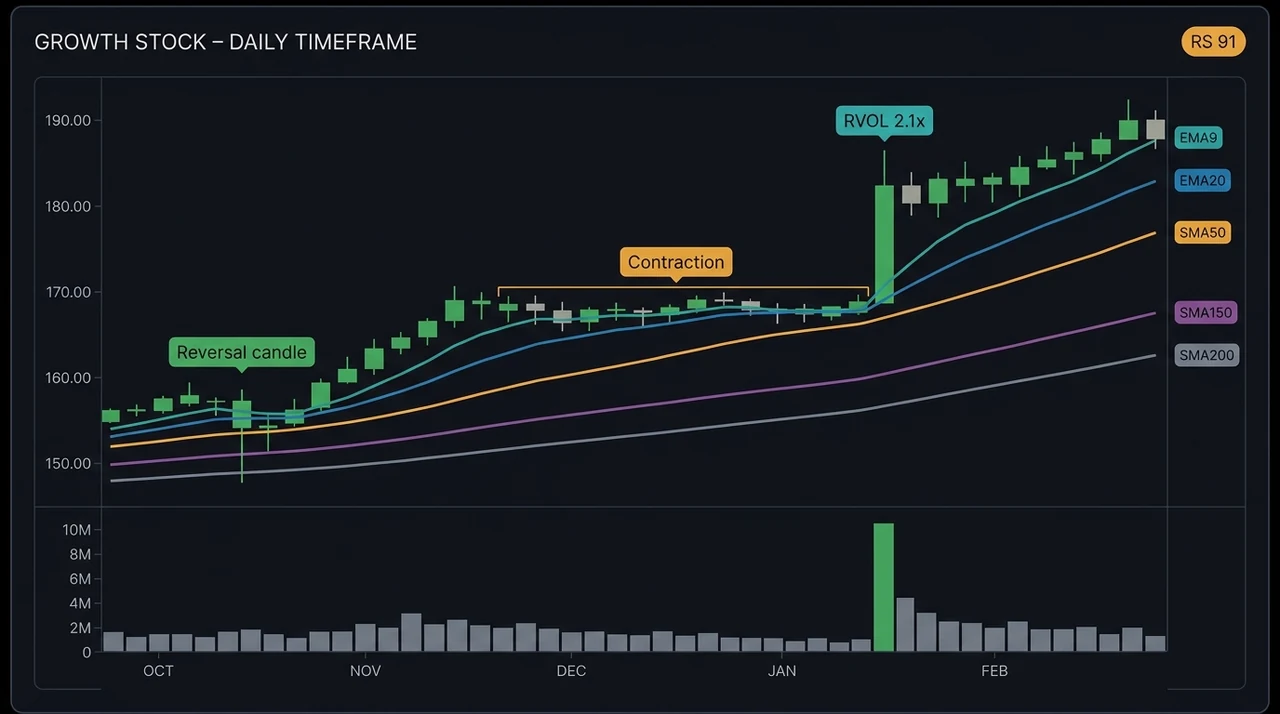
2. Volume contraction in the days before the breakout. In the 3–5 sessions before a clean VCP breakout or bull flag resolution, volume typically shrinks to 0.4–0.7× average. This contraction tells you supply is being absorbed quietly — less and less overhead stock is available to sell into the next leg. When the breakout fires on expansion volume, you have confirmation from both directions: supply dried up, then demand stepped in forcefully.
3. Follow-through volume after the breakout. A single-day surge is not by itself sufficient. The first one to two days after the initial break should show continued above-average RVOL — sustained institutional buying, not a one-day speculative spike followed by a retreat to thin tape. If volume collapses back below average by day two or three while price stalls near the pivot, the breakout is at risk of a backfill and potential failed-pattern outcome.
Volume divergence at a price high is the sharpest warning. A stock that makes a 52-week price high on the lowest RVOL reading in the past 20 sessions is showing that buyers are losing enthusiasm at exactly the wrong moment. That's a deterioration signal regardless of how the chart pattern looks on its own.
Volume During Consolidations: What Healthy Bases Show
During base-building phases — whether a VCP, cup-and-handle, or flat base — volume should trace a predictable asymmetry. Down weeks (or down days) show below-average RVOL. Up weeks show above-average RVOL. This pattern is the signature of accumulation: buyers stepping in on soft tape while sellers control the brief retracements. When the relationship reverses — heavier volume on down days, lighter on up days — the base is showing distribution, and the potential entry is suspect.
The ideal base volume sequence has a staircase shape in reverse: each successive pullback within the pattern is shallower than the last, and each pullback's volume is lighter. Minervini described this explicitly in his analysis of VCP patterns — the shrinking price swings are the visual chart pattern, and the shrinking volume during those swings is the confirmation that institutional sellers are no longer pressing aggressively. Buyers are steadily winning a quieter and quieter contest.
On the MACD histogram, this base phase shows up as a contracting momentum read: bars shrinking toward zero as the stock digests its prior gain. When the histogram bottoms and begins to expand — typically 2–4 bars before the price breaks out of the pattern — volume expansion should follow within a bar or two. The two reads together form the earliest confirmation window available before the entry trigger fires.
For the moving average stack, healthy base behavior keeps all five MAs oriented upward even during the consolidation. If the SMA50 begins to slope flat or downward while the stock is building its base, the trend is deteriorating at the structural level — and volume behavior alone won't save an entry against a weakening stage.
Stage and Regime Context for Volume Signals
Volume signals don't operate independently of market environment. In a Trending Up market regime, institutional flows are tilted toward risk-on, and RVOL expansion at a breakout pivot typically represents genuine buying. In a Choppy regime, breakout volume can reflect a single large buyer who exits after one session, and follow-through is materially harder to find.
Stage 2 alignment sets the prerequisite context. A stage 1 stock (flat or still-basing MAs) that breaks out on 2× volume is a categorically different setup from a confirmed Stage 2 stock resuming a move after a pullback. The volume expansion is identical; the structural context behind it is not. Volume confirmation is a timing tool — it only produces reliable signals when the trend and regime prerequisites are already in place.
The practical hierarchy before any volume read counts as a trade trigger:
- Stage 2 trend confirmed — price above rising EMA20, SMA50, SMA150, SMA200
- Market regime Trending Up or Neutral
- RS rank above 80 — stock stronger than 80%+ of the universe
- Named setup pattern present — VCP, bull flag, pullback to MA, cup-and-handle
- RVOL 1.5× on the breakout bar, or 1.2× on a pullback re-entry
Volume at step 5 adds precision inside a frame that steps 1–4 have already defined. Applying volume screens before the structural checks produces false positives: technically strong-looking volume on stocks that are in Stage 1, in deteriorating regimes, or in weak RS rank cohorts where institutional interest is structurally absent.
The Volume Swing Trading Checklist
Before using volume as a trade confirmation signal:
- ✅RVOL on the breakout bar is 1.5× or above the 20-day average
- ✅Volume was contracting (0.4–0.7×) in the final 3–5 sessions before the breakout
- ✅Down days in the base pattern show lower RVOL than up days — accumulation signature
- ✅Stock is in Stage 2 — price above all five moving averages, all rising
- ✅Market regime is Trending Up or Neutral — not Choppy or Trending Down
- ✅RS rank above 80 — stock stronger than most peers before volume is factored
- ✅For pullback re-entries: RVOL on the re-entry bar is at least 1.2×
- ✅Volume stays above average on day 2 and day 3 after the initial breakout
- ❌Don't treat raw share count as a meaningful volume signal — RVOL is the metric
- ❌Don't use volume as a standalone trigger — structural prerequisites must come first
- ❌Don't dismiss bearish volume divergence — new price highs on declining RVOL is a warning
- ❌Don't require breakout-level RVOL for pullback entries — 1.2× suffices for re-entry confirmation
- ❌Don't read breakout volume as confirmation in Choppy regimes without additional filters
How EasySwing.trading Uses Volume in Setup Grading
EasySwing.trading treats volume as one layer inside the multi-factor grading framework — not as a standalone filter users apply manually. For Trend Pullback and VCP Breakout setups, the volume profile during the base is one of the inputs that separates A-grade candidates from B-grade ones. A pullback on 0.3× RVOL into the EMA20 in a confirmed Stage 2 stock reads differently from the same price level reached on 1.0× RVOL with wider bars — the former shows supply drying up, the latter shows mixed signals.
The A+/A/B+/B/C grade reflects that entire context. An A-grade setup has cleared the volume hurdle — the base showed the right asymmetry (light on down bars, heavier on up bars), and the re-entry condition aligns with buyer activity at the support level. The grade synthesizes volume alongside RS rank, Stage 2 alignment, pattern quality, and regime into a single signal, applied consistently across every stock in the screened universe.
For the broader indicator framework that situates volume alongside moving average alignment, MACD momentum, and Bollinger Band volatility, see Best Indicators for Swing Trading: The 5 That Actually Work and Swing Trading Technical Analysis: A Practitioner's Framework.
Frequently Asked Questions
What is a good RVOL for a breakout entry?
The standard threshold is 1.5× — 50% above the 20-day average. O'Neil's research across 400 market winners set the bar at 40–50% above average, which maps to an RVOL between 1.4 and 1.5. Readings above 2.0× add conviction but can sometimes reflect one-day event-driven buying rather than sustained institutional accumulation. For pullback re-entries, 1.2–1.3× is sufficient.
How is RVOL calculated for swing trading?
RVOL = today's volume ÷ average daily volume over a reference period (typically 20 trading days). If a stock averages 1,000,000 shares per day and trades 1,600,000 today, its RVOL is 1.6. Most charting platforms display this automatically as a relative volume indicator. The 20-day average is the most common baseline for swing trading purposes.
Should I look at volume on daily or weekly charts?
For swing trading entries, the daily chart is the right timeframe. Weekly volume provides useful context for base quality — a stock that shows net accumulation on the weekly (more up-week volume than down-week volume over the past 10 weeks) has a better base than one showing the reverse — but the entry trigger uses the daily RVOL reading on the breakout or pullback bar.
What does high volume on a down day mean?
High RVOL on a down day signals distribution — institutional sellers unloading shares into buying interest. A single heavy-volume down day after a strong advance (a "churning" or "reversal" bar) often marks the beginning of a correction or base period. During a consolidation, heavy down-day volume is a red flag: it suggests the base is showing distribution rather than accumulation. Compare the down-day RVOL to up-day RVOL across the base — the ratio tells the story.
Can a breakout work on below-average volume?
Occasionally, but the odds are materially lower. In O'Neil's study, 95% of the biggest winners showed volume expansion at the initial breakout. The 5% that didn't tended to be in extreme bull market conditions with very limited floating supply — rare setups with other structural differences. For standard swing trading conditions, a breakout on below-average volume should be treated as unconfirmed until RVOL expands in subsequent sessions.
EasySwing.trading automatically screens for volume-confirmed setups across 2,000+ US stocks — every A-grade candidate has cleared Stage 2, regime, RS rank, and volume profile checks before appearing in scan results. For the full technical analysis framework, see Best Indicators for Swing Trading and Swing Trading Technical Analysis: A Practitioner's Framework. Scan results are for informational purposes only. See our Risk Disclaimer.
Disclaimer: This article is for educational purposes only and does not constitute investment advice. EasySwing is a stock screening tool, not a registered investment advisor. All trading involves risk. Read our full disclaimer →