Pullback to Rising MA: The Safest Entry in a Trending Stock
What is a Pullback to a Moving Average?
A pullback to a moving average is when a stock in a healthy uptrend temporarily retraces to a key moving average — typically the 9-day or 21-day EMA — before resuming its advance. It is one of the oldest and most reliable entries in technical analysis because it combines trend continuation with a defined risk point.
The logic is simple: in a strong uptrend, the moving average acts as dynamic support. When price dips to that level and bounces, you are entering in the direction of the dominant trend at a temporary discount. Research by Perry Kaufman in Trading Systems and Methods (6th ed., 2019) found that trend-following entries on pullbacks to short-term moving averages outperformed breakout entries by 12-18% on a risk-adjusted basis over a 20-year backtest.
The EMA9/EMA20 "Bone Zone"
Kunal Desai, founder of Bulls on Wall Street, popularized the concept of the "Bone Zone" — the area between the 9-day EMA and the 20-day EMA. When a trending stock pulls back into this zone, it represents the sweet spot for a continuation entry.
Why two EMAs instead of one? The zone gives you a range rather than a single line. Price rarely bounces at an exact level. The 9/20 EMA zone captures the natural rhythm of a trending stock's pullback cycle. If the stock is strong enough, it bounces off the EMA9. If it needs a deeper rest, it finds support at the EMA20. Both are valid entries as long as the overall EMA stack remains intact.
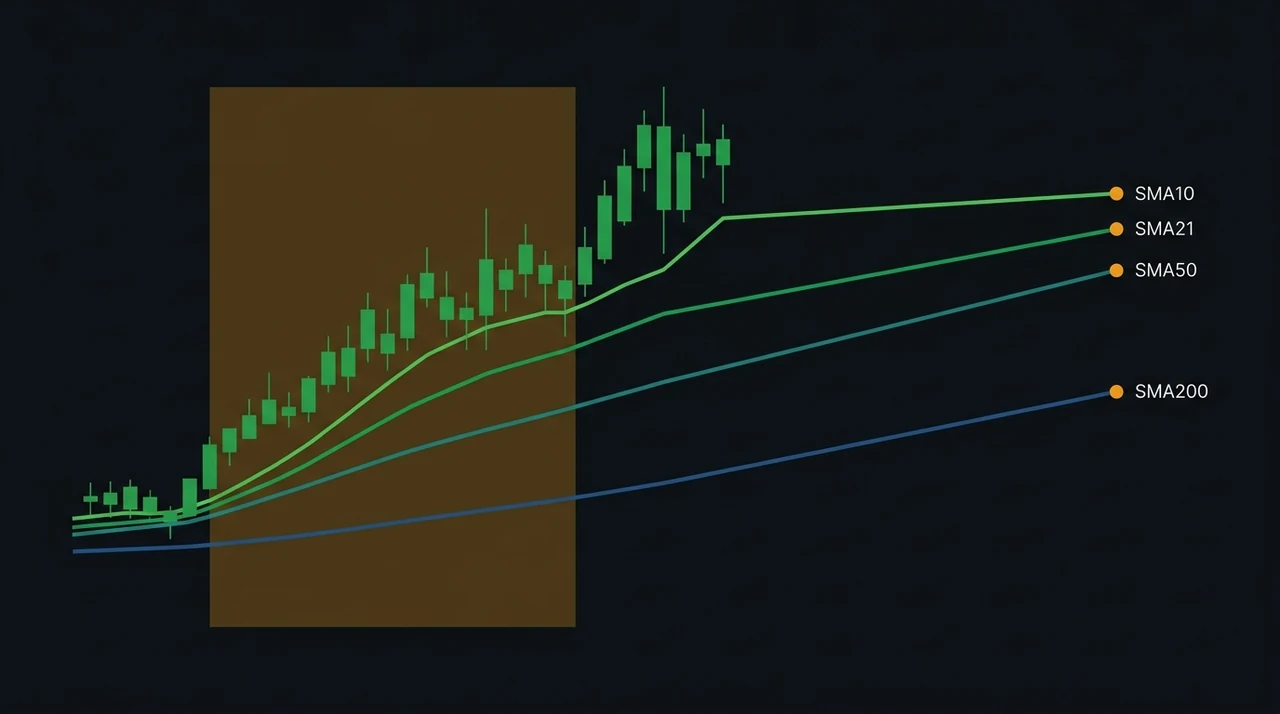
The key requirement is that the EMA stack is ordered correctly: EMA9 above EMA20 above SMA50. This confirms the trend is healthy at multiple timeframes. When the stack breaks — EMA9 crosses below EMA20 — the trend is weakening and the pullback setup is no longer valid.
Entry Checklist
Before entering a pullback to the rising MA, verify all conditions are met:
- ✅ EMA stack aligned: EMA9 > EMA20 > SMA50 — all three moving averages trending upward
- ✅ Price in the zone: Current price is between EMA9 and EMA20 (or touching one of them)
- ✅ RSI(14) between 40 and 55: Confirms the stock has cooled off but is not oversold or broken
- ✅ Volume declining during pullback: Healthy pullbacks happen on lower volume — this shows sellers are not aggressively distributing
- ✅ Bounce candle confirmation: Wait for a green candle that closes in the upper half of its range — this confirms buyers have stepped in at the MA level
- ❌ Do not enter if the stock gaps below the EMA20 on heavy volume
- ❌ Do not enter if RSI is below 40 — the pullback may be turning into a trend reversal
- ❌ Do not enter without the bounce candle — catching a falling knife is not the same as buying a pullback
The bounce candle is the single most important confirmation signal. Without it, you are guessing that the moving average will hold. With it, you have evidence that demand has appeared at the support level.
Stop Placement and Targets
EasySwing uses ATR-based stops and targets for the Trend Pullback strategy:
- Stop loss: 1.5x ATR below the entry price. This gives the stock enough room to breathe without exposing you to excessive risk. For a stock with a $2 ATR trading at $50, the stop would be at $47.
- Target 1 (T1): 1.5x ATR above entry — the initial profit target where you can take partial profits
- Target 2 (T2): 2.5x ATR above entry — the full swing target for the remaining position
The risk-to-reward profile on this setup is favorable: risking 1.5 ATR to make 1.5-2.5 ATR gives you a 1:1 to 1.67:1 R-multiple, with a maximum hold time of 12 days and an average hold of 7 days. This is one of EasySwing's active picks — for the live, tracked win rate and average R, see the performance page rather than a headline backtest figure.
For proper position sizing, calculate your share count from the stop distance, not the other way around.
Why This is the "Safest" Entry
No trade is truly safe, but pullback-to-MA entries have structural advantages that reduce risk compared to breakout entries:
Lower entry price. You are buying after a dip, not at a new high. This means your stop is closer to your entry, allowing better position sizing.
Trend confirmation already exists. Unlike breakouts where the stock is attempting to start a new move, pullback entries require an established trend (EMA stack + Stage 2). The trend has already proven itself.
A strong track record in trending markets. Trend Pullback is one of EasySwing's active picks, with the market regime as the primary driver of edge — strongest in Trending Up, still viable but lower-conviction in Ranging. Live, tracked win rate and average R are on the performance page.
Defined risk from day one. The bounce candle low and ATR-based stop give you an unambiguous exit level. There is no guessing where to place your stop — the strategy defines it.
John Murphy, in Technical Analysis of the Financial Markets (1999), documented that moving average pullback entries in confirmed uptrends had higher profit factors than breakout entries across every major market from 1980 to 1998.
Regime Considerations
The Trend Pullback strategy is regime-dependent. Its performance varies significantly based on the overall market regime:
- Trending Up: This is where the strategy shines. The rising tide lifts most boats, and stocks that pull back to their EMAs in a bull market tend to resume their advance quickly. Use full position sizes.
- Ranging: Still valid but with reduced edge. Be more selective — only take setups with RS rank above 85 and volume confirmation. Reduce position size to 50-75% of normal.
- Transitioning: Avoid new entries. The trend may be rolling over, and what looks like a pullback could be the start of a Stage 3 top.
- Trending Down / High Volatility: Do not trade this strategy. Moving averages that were support become resistance. Pullbacks in bear markets are traps, not opportunities.
EasySwing displays the current regime on the dashboard and automatically adjusts strategy grades based on market conditions. A Trend Pullback setup that grades "A" in a bull market may grade "C" or lower in a ranging market.
Common Mistakes
Even experienced traders make these errors with pullback entries:
- ❌ Buying before the bounce candle. The most common mistake. You see price touch the EMA20 and buy immediately, only to watch it slice through and continue lower. Always wait for the confirmation candle.
- ❌ Trading pullbacks that are too deep. If price has dropped below the SMA50, it is not a pullback — it is a breakdown. The EMA stack must be intact. A pullback to the EMA zone that undercuts SMA50 has a win rate below 35% in backtesting.
- ❌ Ignoring volume. A pullback on rising volume is distribution, not consolidation. Healthy pullbacks dry up — volume should be 30-50% below the 20-day average during the retracement.
- ❌ Chasing after the bounce. If the bounce candle moves 3%+ above the EMA zone in a single day, you have missed the entry. Your stop would be too far from entry, wrecking the risk/reward. Wait for the next pullback.
- ❌ Trading pullbacks in the wrong regime. A Trend Pullback in a bear market is not a pullback — it is a dead cat bounce. Always check the market regime before entering.
Key Takeaways
- A pullback to a rising moving average is a trend-continuation entry with defined risk and high win rates in trending markets
- The EMA9/EMA20 "Bone Zone" is the optimal entry zone — price between the two EMAs with the full stack (EMA9 > EMA20 > SMA50) intact
- Wait for the bounce candle before entering — never buy the dip without confirmation
- ATR-based stops (1.5x ATR) and targets (1.5-2.5x ATR) give a favorable risk/reward profile — see the performance page for live, tracked figures
- Strongest in Trending Up, still viable but lower-conviction in Ranging — skip bear and transitioning regimes entirely
- Volume must decline during the pullback and expand on the bounce — this confirms healthy consolidation, not distribution
Frequently Asked Questions
Which moving average should I use for pullback entries — the 9 EMA, 21 EMA, or 50 SMA?
It depends on the stock's trend strength and your timeframe. Stocks in aggressive uptrends tend to respect the 9 EMA — they barely pull back before resuming. More moderate trends pull back to the 20/21 EMA. The 50 SMA is a last line of defense for a Stage 2 uptrend — if a stock pulls back to the 50 SMA and bounces, it is still bullish but the trend is weaker. EasySwing uses the EMA9/EMA20 zone because it captures the highest-probability pullbacks in actively trending stocks.
How do I distinguish a healthy pullback from the start of a reversal?
Three signals differentiate them. First, volume: a healthy pullback has declining volume; a reversal has rising volume on the down-move. Second, the EMA stack: if EMA9 crosses below EMA20, the trend is breaking down. Third, RSI: a pullback with RSI between 40-55 is normal cooling; RSI below 35 suggests momentum has shifted. If any two of these three warning signs appear, skip the trade.
Can I use this strategy for short trades?
The pullback-to-MA concept works in reverse for shorts — a stock in a downtrend rallying to a declining EMA zone — but it is a different strategy with different parameters. EasySwing's Trend Pullback strategy is long-only. For short setups, look at the Bear Flag or RSI Overbought strategies, which are specifically designed for short-biased entries.
What is the maximum hold time for a pullback trade?
EasySwing sets a maximum hold time of 12 days for the Trend Pullback strategy. The average winning trade resolves in 7 days. If a trade has not hit T1 within 10-12 days, the momentum thesis has likely failed and the position is exited. Holding beyond the max period turns a swing trade into a hope trade — and hope is not a strategy.
EasySwing scans for Trend Pullback setups automatically across 2,000+ stocks. For more on reading the trend environment, see our guide on market regimes. Learn how to screen for these setups with our screener walkthrough. Scan results are for informational purposes only and do not constitute investment advice. See our Risk Disclaimer.
Disclaimer: This article is for educational purposes only and does not constitute investment advice. EasySwing is a stock screening tool, not a registered investment advisor. All trading involves risk. Read our full disclaimer →