Fibonacci Retracement in Swing Trading: 3 Levels That Work
Thomas Bulkowski analyzed thousands of continuation chart patterns in Encyclopedia of Chart Patterns (3rd ed., 2021) and found that the median pullback depth before a successful breakout continuation ran to approximately 38% of the prior advance. Fibonacci retracements are not mystical price levels. They are the zones where institutional participants, following the same analytical frameworks across portfolios, consistently re-enter a trend after a pullback — and that synchronicity creates self-fulfilling support.
Three Fibonacci levels do most of the work in equity swing trading: 38.2%, 50%, and 61.8%. This guide covers why each level matters, how to anchor the grid correctly, and where Fibonacci analysis fails — which is as important as where it works.
What Fibonacci Retracement Actually Measures
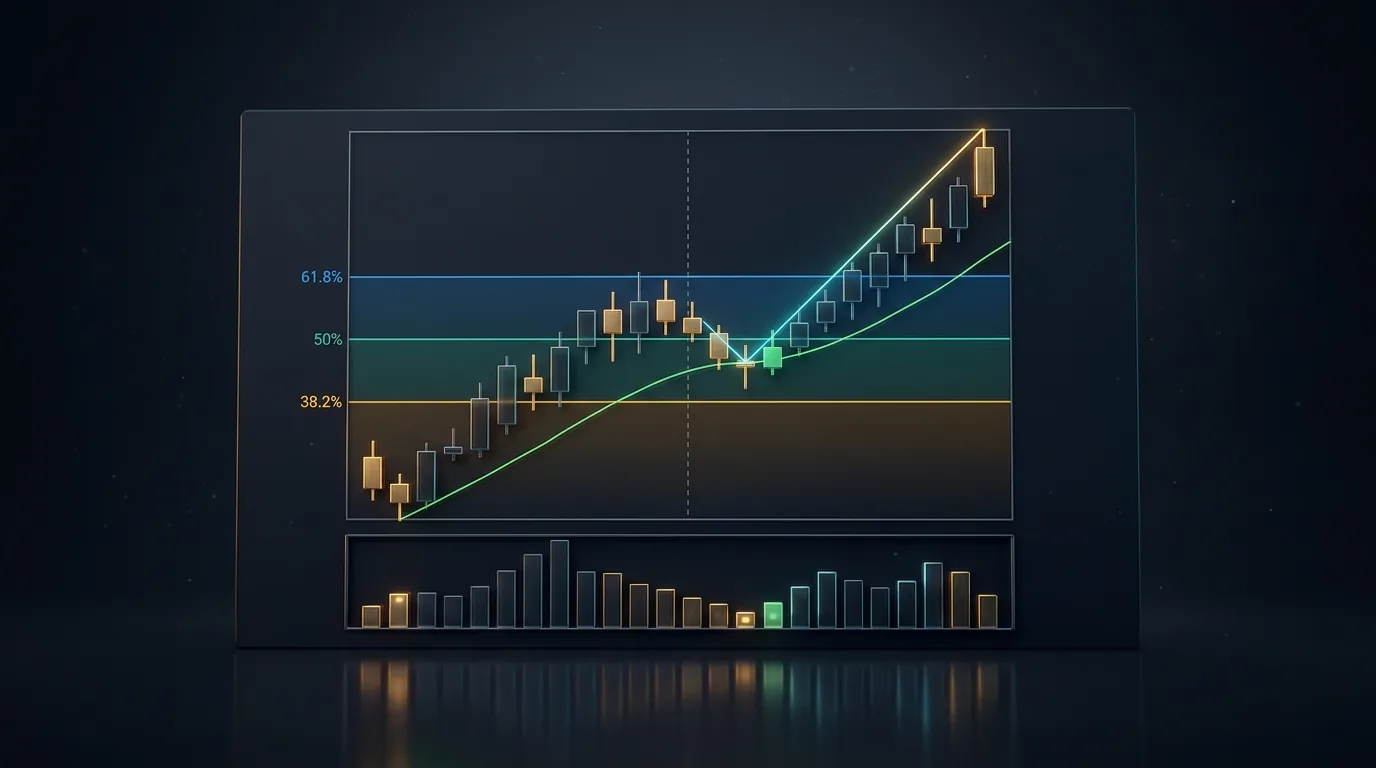
Fibonacci retracement uses horizontal lines drawn at the key ratios of the Fibonacci sequence — 38.2%, 50%, and 61.8% — to identify zones inside a larger trend where a corrective move is statistically likely to find support or resistance before the primary trend resumes.
A pullback to a Fibonacci level reflects proportional supply and demand behavior. As an uptrend extends, profit-takers exit positions proportionally to their gain. The strongest selling pressure concentrates around the ratios where prior buyers are breaking even on earlier purchases — and when those sellers exhaust, the buyers already positioned in the trend add to their holdings. That buyer-seller equilibrium produces the recurring support behavior observable at specific percentage retracements.
Leonardo Fibonacci introduced the mathematical sequence in Liber Abaci (1202), but its application to financial markets developed through Ralph Nelson Elliott's wave analysis in the 1930s and W.D. Gann's practical work on retracement levels in commodity futures. By the 1970s, the 38.2%, 50%, and 61.8% levels had been formalized as universal correction benchmarks, and J.M. Hurst documented their presence in equity price cycles in The Profit Magic of Stock Transaction Timing (1970).
The 3 Fibonacci Levels That Work for Swing Trading
Three ratios — 38.2%, 50%, and 61.8% — account for the vast majority of practical pullback entries in swing trading. The 23.6% level is too shallow to provide meaningful entry risk/reward structure. The 78.6% level is so deep that the original swing point is nearly negated — at that depth, the better question is whether the trend has ended, not where to enter on a pullback.
38.2%: The Shallow Retracement in Strong Trends
A 38.2% retracement marks the shallowest meaningful correction in a trending stock. In a strong Stage 2 uptrend where institutional demand is heavy, price often pauses at 38.2% and resumes without deeper correction. Mark Minervini described this behavior in Trade Like a Stock Market Wizard (2013): "In the most powerful advancing stocks, the corrections are brief and shallow — that is the sign of persistent institutional demand, not a warning that the trend is ending."
Entering at 38.2% carries higher conviction but tighter stop tolerance. The ideal trigger is a bounce confirmation candle — a session that opens at or below the 38.2% level and closes back above it on relative volume (RVOL) at 1.2× or higher. A close below 38.2% without a same-session reversal means price has moved to the next level.
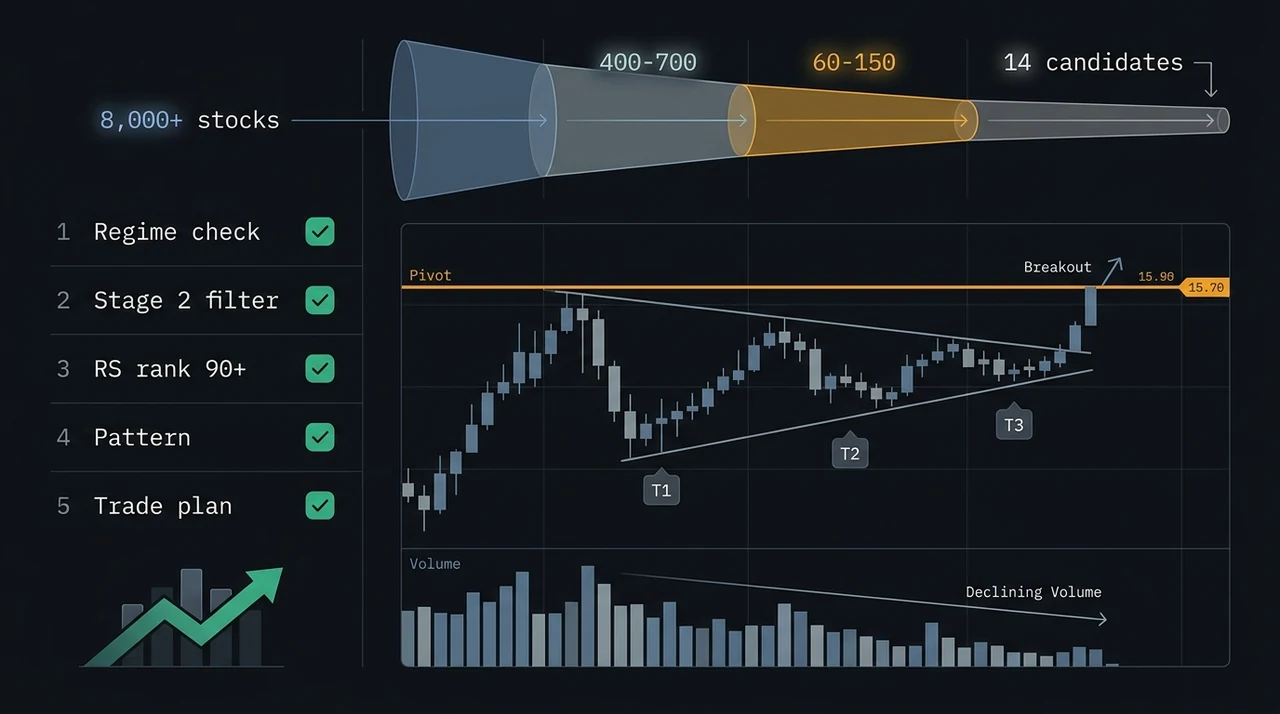
In the VCP pattern, the tightest contractions — the final T3 or T4 compression before the breakout — often measure a 38.2% retracement of the prior advance within that contraction. That proportion is not a coincidence; it reflects the same institutional accumulation behavior that makes the Fibonacci level significant at the swing-trade scale.
50%: The Most Commonly Used Level
The 50% retracement is the most widely observed Fibonacci level in institutional trading — not because it derives from the sequence directly (it is the arithmetic midpoint of any move), but because W.D. Gann's mid-point rule established it as a structural benchmark: a healthy trend should not retrace more than half of its prior advance before resuming.
William O'Neil reinforced this in How to Make Money in Stocks (2009): the handle construction in a cup and handle base frequently forms around the 50% retracement of the prior advance. Price retracing to the 50% zone with contracting volume above it is one of the clearest signatures that the dominant buyers from the prior advance are still holding their positions and not distributing.
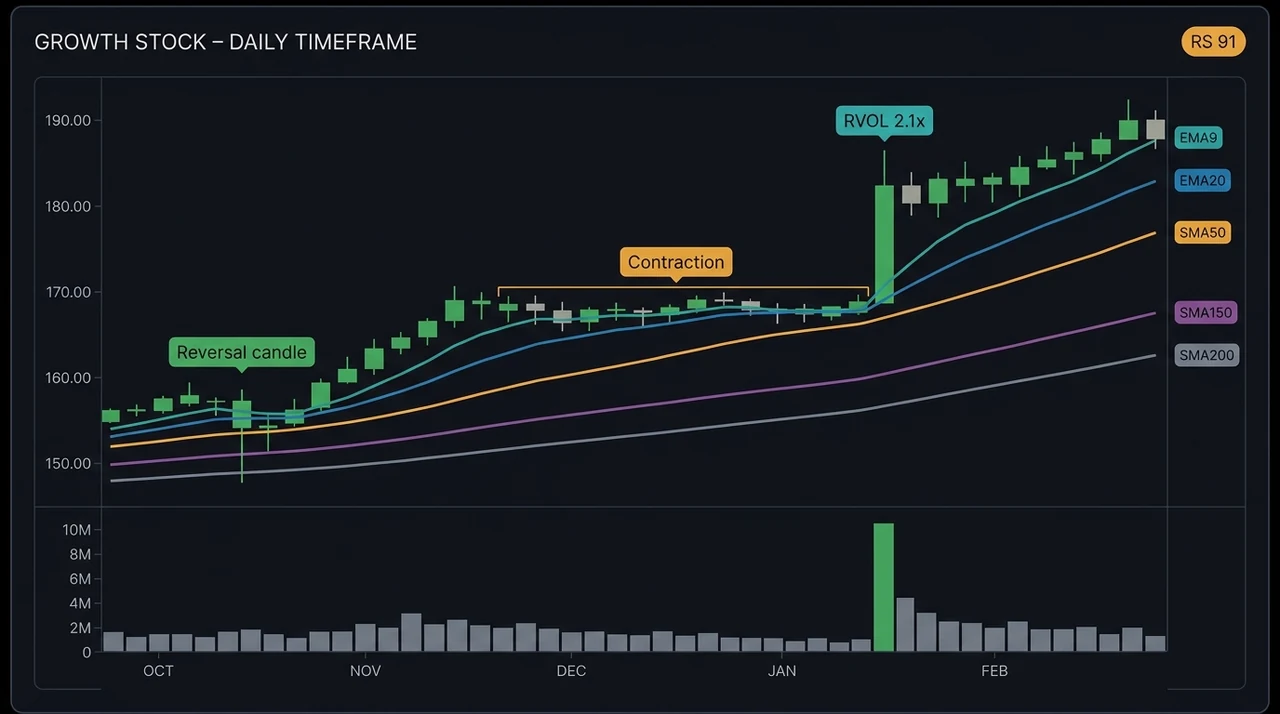
The 50% level also produces the most moving average confluence opportunities. When the EMA20 or SMA50 naturally rises to meet price at the 50% Fibonacci zone during a pullback, the combined support structure is typically more durable than either level alone.
61.8%: The Golden Ratio Floor
The 61.8% level — derived by dividing any Fibonacci number by its immediate successor — is the golden ratio and represents the deepest valid retracement before a trend break becomes probable. Entries at 61.8% require the widest stop placement because the stop must sit below both the 61.8% level and the prior swing low to be structurally valid.
A 61.8% retracement in an uptrend typically occurs after a more aggressive correction driven by a market regime deterioration, sector rotation, or a macro event that temporarily overwhelms institutional demand. If the broader market regime remains bull, and the stock is still trading above its SMA150 and SMA200 with those averages still sloping upward, a 61.8% pullback presents a structurally valid deep-entry opportunity.
Bulkowski (Encyclopedia of Chart Patterns, 3rd ed., 2021) found that roughly 40% of pullbacks inside continuation patterns extend to the 61.8% level before reversing — so expecting every pullback to hold at 38.2% or 50% produces entries that frequently stop out before the actual reversal occurs.
How to Draw Fibonacci Levels Correctly
The most common Fibonacci error is anchoring the grid to the wrong pivot points. For a long trade, place the zero anchor at the most significant recent weekly swing low and the 100% anchor at the most recent weekly swing high before the current pullback began.
Three rules for consistent anchoring on a daily chart:
- Use weekly pivot closes, not intraday extremes. A swing low that spans two to four weeks and has a meaningful close is more significant than a single-session spike low. If the swing-low session has an exaggerated wick from a news spike, anchor at the closing price of that session — that is where institutional buyers actually participated.
- Re-anchor after a confirmed higher high. Once a stock makes a new swing high above the prior 100% anchor and then pulls back, recalculate the Fibonacci grid from the new swing low to the new swing high. Old grid lines become noise; the current trend leg is the relevant measurement.
- Invert for short setups. For a bear flag or other short setup, place zero at the most recent swing high and 100% at the swing low below it. The 38.2%, 50%, and 61.8% levels then identify the zones where a short-covering rally is likely to exhaust before the downtrend resumes.
Fibonacci and Moving Averages: The Confluence Entry
The highest-probability Fibonacci entries occur when a retracement level aligns within 1% of a rising moving average. The EMA20 and SMA50 naturally converge toward Fibonacci levels during healthy pullbacks in Stage 2 uptrends — not by design, but because both frameworks track the same underlying institutional behavior at proportional price-level intervals.
When price pulls back to the 38.2%-50% Fibonacci zone and the EMA20 or SMA50 has risen to meet it, the entry carries two independent structural supports confirming the same zone. That convergence is not coincidence. Both frameworks identify where the largest concentration of prior buyers chose to accumulate. Their intersection confirms the price zone is institutionally significant, not just mathematically drawn on a chart.
The support and resistance framework adds a third layer. If a prior base breakout pivot aligns with the 50% retracement and the EMA20 has risen to the same price, you have three independent signals — Fibonacci proportion, dynamic MA support, and horizontal pivot S/R — all identifying the same entry zone. That three-way confluence is among the highest-probability structures in swing trading.
Minervini described the underlying principle in Think and Trade Like a Champion (2017): "The best entry points concentrate multiple forms of structural evidence at the same price — that is when the crowd is wrong and the setup is right." Confluence is the quantification of that principle.
Common Fibonacci Mistakes That Trap Swing Traders
The most common error is applying Fibonacci analysis without first confirming the trend context. A 61.8% retracement in a Stage 4 downtrend is not a valid long entry — it is a lower high in a distribution phase. Fibonacci levels identify where pullbacks inside trends are likely to end; they do not determine whether the primary trend is bullish. Trend context comes first.
Anchoring to the wrong pivot. Most Fibonacci errors start here. Anchoring the grid to a minor intraday swing rather than a weekly pivot places the 38.2% and 50% lines at meaningless prices. Use weekly swing highs and lows for grid anchors on a daily chart.
Expecting price to stop at a precise number. Fibonacci zones are areas, not lines. A stock that pulls back to 48% when you drew the 50% level is at the 50% zone — standard tolerance is ±2% around each level. Waiting for a print at exactly 50.00% produces missed entries.
Entering without a reversal trigger. A price approaching 50% is not an entry signal. A reversal candle at the 50% level — a closing price that rejects the zone on the day of contact — is the entry trigger. The level identifies the zone; the candle confirms that demand has actually stepped in.
Layering multiple Fibonacci grids. On any given chart, it is possible to draw legitimate grids from the major swing two months ago, the minor swing last week, and the extension from the current leg. Running three grids simultaneously produces a chart dense with horizontal lines at every possible price. One primary grid anchored to the major current-leg swing is the correct approach.
Regime Context Determines When Fibonacci Works
Fibonacci retracement analysis performs best when the broader market is in a bull or transitional regime. In a confirmed bull regime, the 38.2%-50% zone becomes a consistent re-entry area as institutional participants add to positions on organized pullbacks within the trend structure.
In a choppy or bear regime, pullbacks do not reliably stop at Fibonacci levels because the underlying institutional demand that creates the self-reinforcing support has not been established or has been withdrawn. The same 50% retracement that signals a textbook pullback entry in a bull regime signals a dead-cat bounce in a bear regime. The chart pattern looks identical; the regime context determines the probability.
EasySwing's regime filter addresses this. Bullish pullback setups — including trend pullback entries at the EMA20 and SMA50 — are not generated in a choppy or bear market. The same logic applies to Fibonacci-based analysis: the retracement level is only a valid input when the broader structure supports the continuation trade.
Fibonacci Swing Trading Checklist
Use this checklist before entering a Fibonacci pullback entry:
- ✅Stock is in a confirmed Stage 2 uptrend — EMA20, SMA50, SMA150, and SMA200 all sloping upward
- ✅Market regime is bull or transitional, not choppy or bear
- ✅Price has pulled back to a Fibonacci level (38.2%, 50%, or 61.8%) on declining RVOL
- ✅A Fibonacci level is within 1% of a rising EMA20 or SMA50 (confluence zone)
- ✅A reversal candlestick — hammer, bullish engulfing, or inside-day close above the level — has printed at the zone
- ✅RS rank is 70 or above — the stock remains a relative market leader during the pullback
- ✅Stop is placed below the Fibonacci level and the nearest prior swing low, not on the Fibonacci line itself
- ✅Risk/reward is at least 2:1 to the prior swing high as the initial target
- ❌Do not enter at a 61.8% level if the SMA150 or SMA200 is declining
- ❌Do not treat price reaching a Fibonacci zone as a buy signal without a reversal trigger candle
- ❌Do not enter if RVOL is expanding on the down day — expanding volume in a decline signals distribution, not exhaustion
- ❌Do not use Fibonacci in isolation — always combine with the MA stack and market regime context
- ❌Do not apply Fibonacci grids to stocks in Stage 3 or Stage 4 — there is no trend structure to support the framework
Frequently Asked Questions
What is the most important Fibonacci retracement level for swing trading?
The 50% level has the strongest institutional consensus. W.D. Gann's mid-point rule, O'Neil's cup-and-handle handle construction, and the median pullback data from Bulkowski's pattern research all converge on 50% as the most commonly observed correction depth. In a very strong trend, a shallow 38.2% retracement marks the floor instead — the deeper 50% typically appears after a faster initial advance.
How do I draw Fibonacci levels correctly on a daily chart?
Place the zero anchor at the most significant recent weekly swing low and the 100% anchor at the most recent weekly swing high before the current pullback began. Use weekly closing prices for the anchors, not intraday wicks. Re-anchor the grid each time the stock makes a new confirmed swing high so the levels always reflect the current trend leg rather than a prior one.
What is the difference between Fibonacci retracement and Fibonacci extension?
Fibonacci retracement measures how far a correction moves inside a prior advance — it identifies the entry zone. Fibonacci extension projects where price may reach after the pullback completes — the 127.2%, 161.8%, and 261.8% extension levels above the prior swing high are the most common target zones. Retracement levels identify where to enter; extension levels identify where to take profit.
Does Fibonacci analysis work in a bear market?
No. Fibonacci retracement depends on a primary trend that institutional participants are actively trading with consistent entries. In a bear or choppy regime, the institutional demand that creates self-reinforcing behavior at Fibonacci levels is absent or fragmented. Using Fibonacci in those conditions produces false signals at otherwise mathematically valid price zones. Confirm the market regime before applying any Fibonacci-based entry logic.
Why do Fibonacci levels appear in stocks, commodities, and currencies?
Because Fibonacci ratios describe proportional human behavior under conditions of gain and loss, not specific price levels. The 61.8% level approximates the point where a prior buyer who held through a full advance-and-correction cycle becomes emotionally motivated to sell whatever gain remains. That behavior appears across asset classes and time frames because the underlying decision-making threshold is the same regardless of the instrument being traded.
EasySwing.trading automatically screens for pullback entries at key trend support zones across 2,000+ US equities each trading day. When the market regime is bull, the trend pullback and VCP strategies detect candidates where moving average alignment, volume contraction, and pattern structure converge — the same conditions where Fibonacci retracement analysis is most reliable. See also: Pullback to Rising MA: The Safest Entry in a Trending Stock and Support and Resistance in Swing Trading. Scan results are for informational purposes only. See our Risk Disclaimer.
Disclaimer: This article is for educational purposes only and does not constitute investment advice. EasySwing is a stock screening tool, not a registered investment advisor. All trading involves risk. Read our full disclaimer →