How to Find Swing Trades: A 5-Step Pre-Session Framework
William O'Neil's landmark study of the 600 biggest stock market winners from 1953 to 2001 found they shared a recurring set of technical characteristics in the weeks before their largest advances (How to Make Money in Stocks). The challenge isn't that high-quality swing trade setups are rare — it's that they're invisible without a structured process for finding them each session.
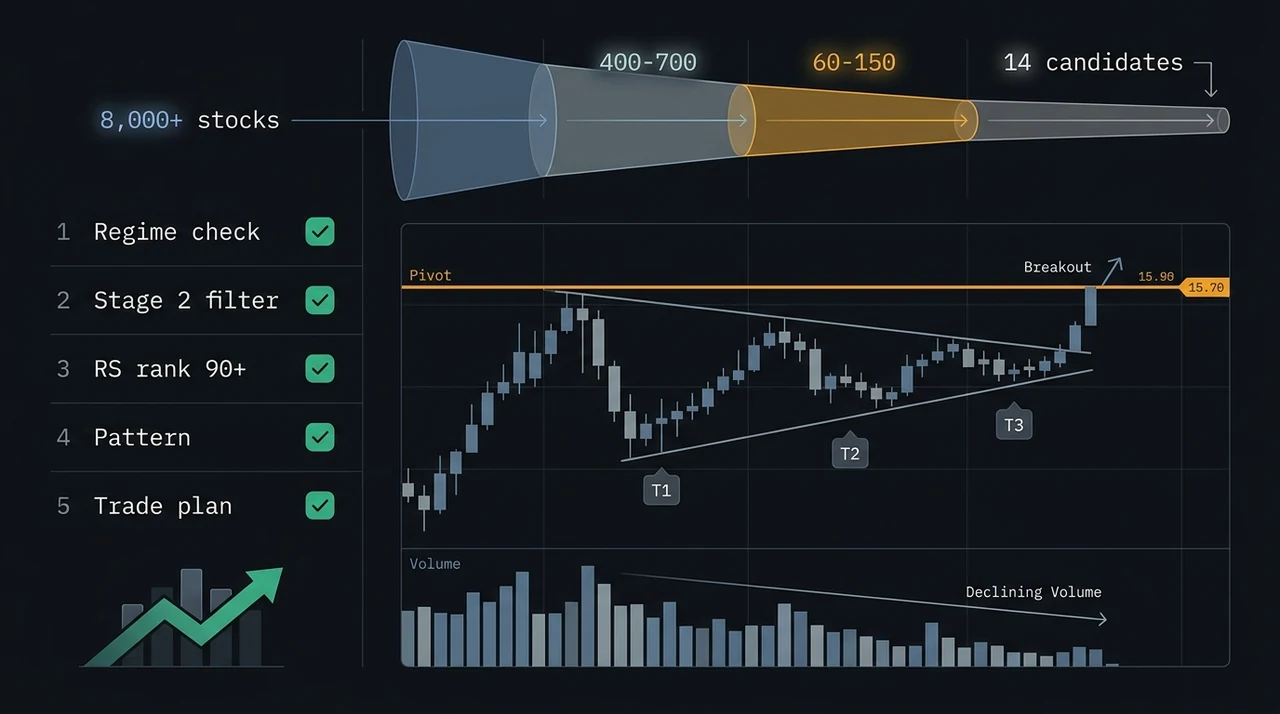
The short answer: finding swing trades is a five-step filtering process that narrows the full market from 8,000+ listed equities down to a short list of 5–15 candidates with pre-written trade plans. The five steps are market regime check, Stage 2 trend filter, relative strength screen, setup pattern identification, and pre-session trade plan writing. Most traders skip at least one of these steps — which is why most traders produce results below their theoretical edge.
Step 1: Check the Market Regime Before Looking at Individual Stocks
The market regime — Trending Up, Trending Down, Ranging, or High Volatility — determines the base rate of success for every swing trade you consider. In a confirmed Trending Up regime, breakout setups follow through at meaningfully higher rates. In Ranging or Trending Down conditions, the same setups fail more often regardless of how clean the individual chart looks.
Checking the regime is the first and highest-impact step. It takes five minutes once the workflow is established. Four data points are sufficient for a reliable daily regime read:
- Is the S&P 500 above its 200-day moving average?
- Is the advance-decline line trending up or declining over the past three to four weeks?
- Is the count of stocks making new 52-week highs exceeding stocks making new 52-week lows?
- Is implied volatility (VIX) elevated (above 25) or calm (below 18)?
Stan Weinstein's foundational stage analysis — documented in Secrets for Profiting in Bull and Bear Markets (1988) — is built on the same principle: identify what stage the overall market is in first, because the market's stage shapes the odds for every individual position.
Jegadeesh and Titman's momentum research (Journal of Finance, 1993) confirmed the market-dependency of setup performance: the 12% annualized excess returns they documented for top-decile momentum strategies were concentrated in favorable market conditions. The same methodology applied in adverse environments produced drawdowns, not gains. The regime check isn't a refinement of the process — it's the foundation.
For a complete breakdown of how to classify current conditions — and how a five-state regime model affects which strategies are eligible each session — see market regime: bull, bear, and choppy markets.
Step 2: Filter the Full Universe to Stage 2 Stocks
Once the regime confirms a favorable environment for long setups, the next step narrows the 8,000+ listed US equities to the subset that qualifies as Stage 2 — the advancing phase where institutions are actively accumulating and the trend has confirmed structural support.
Stage 2 criteria (synthesized from Weinstein and Minervini):
- Price is above the 50-day moving average
- The 50-day MA is above the 150-day MA
- The 150-day MA is above the 200-day MA
- All three moving averages are sloping upward
- The stock is within 25–30% of its 52-week high
Any stock below its 200-day moving average, or where the 200-day MA itself is declining, fails the Stage 2 test regardless of any other characteristic. This single filter eliminates the long tail of declining, basing, and Stage 3 topping stocks — leaving only companies already in the advancing phase.
In a healthy bull market, roughly 400–700 stocks pass the Stage 2 filter simultaneously. That number is still too large to review individually, but it is the right pool. You're not trying to find the next turnaround story or bottom-fish a declining stock — you're looking for confirmed leadership that's already moving in the right direction.
The Stage 2 stock analysis guide covers the criteria in detail, including how the MA stack interacts with trend-quality scoring.
Step 3: Apply the Relative Strength Rank Screen
After the Stage 2 filter, apply a relative strength rank threshold to further narrow the candidate pool to market leaders. Relative strength rank (RS rank) measures a stock's 12-month price performance against the full market, scored from 0 to 99. A rank of 90 means the stock has outperformed 90% of all other stocks over the past year.
Filtering for RS rank 80+ reduces the Stage 2 universe from 400–700 stocks to roughly 60–150. That is the right subset — concentrated at the market leaders rather than the average performers. Minervini makes the same point in Think and Trade Like a Champion (2017): he favors stocks already showing leadership — an RS rank of 80 climbing toward 90 — over weaker names a trader merely hopes will improve.
O'Neil's analysis of the biggest market winners confirmed the pattern empirically: they carried RS ranks of 80 or higher before their most significant advances, averaging around 87 (How to Make Money in Stocks).
| RS Rank Threshold | Universe Size (healthy bull market) | What It Represents |
|---|---|---|
| No filter | 8,000+ stocks | Full US equity universe |
| Stage 2 only | 400–700 stocks | Confirmed uptrends |
| RS rank 80+ | 60–150 stocks | Market leaders in uptrends |
| RS rank 90+ | 20–60 stocks | Top-tier momentum leaders |
The RS rank filter is not about finding the fastest-moving stocks — it is about identifying the stocks that the most buyers are already buying. Those are the stocks most likely to continue advancing when a broad market rally has legs. For a full explanation of how RS rank is calculated and why the 90+ threshold is the signal threshold for the highest-confidence setups, see relative strength rank: how to screen for RS 90+ stocks.
Step 4: Identify High-Probability Setup Patterns
With the universe filtered to 60–150 Stage 2, RS-leading stocks, the fourth step is pattern recognition — finding which of those candidates are near a specific, defined entry trigger.
The pattern step is where most traders apply the most judgment and where most errors occur. A candidate that has Stage 2 structure and a strong RS rank but is extended 20% above a base has no valid entry. The pattern requirement filters for proximity to an entry trigger, not just trend quality.
The most common swing trading setups and their entry triggers:
| Setup | What It Shows | Entry Trigger | Stop Placement |
|---|---|---|---|
| VCP breakout | Tightening contractions, volume dry-up | Break above final pivot on 2× average volume | Below T3 or T4 structural low |
| Cup & Handle breakout | Rounded base with a short downward-drifting handle | Break above the handle pivot on expanding volume | Below the handle low |
| Pullback to rising MA | Retrace to 10- or 21-day EMA in uptrend | Reversal candle at the MA with volume recovery | Below the MA or recent swing low |
| High RS breakout | 52-week high on above-average volume | Close above prior high with RVOL above 1.5× | Below the breakout bar low |
The discipline here is precision. A stock that shows two contractions (T1 and T2) but where T2 is not clearly shallower than T1 does not qualify as a VCP. A pullback that goes below the 50-day MA is not a pullback to the 21-day EMA — the structure has already been violated. If a pattern requires interpretation, it doesn't qualify. A clear setup is clear. The ambiguity is the signal to wait.
At this stage, the candidate list typically narrows from 60–150 to 5–20 stocks with defined, unambiguous patterns near an entry trigger. These are the candidates that move to the trade plan step.
Step 5: Write the Trade Plan Before the Market Opens
This step separates systematic traders from the majority of retail participants. Most traders identify a setup candidate in the morning session and decide whether to enter in real time — making the entry decision while price is moving, social media is running, and the recent session results are fresh in memory.
Pre-writing the trade plan eliminates those variables. Decisions are made the evening before, when no position is open, no P&L is moving, and no emotional pressure exists. The session itself becomes execution: price either reaches the trigger or it doesn't.
Each trade plan documents:
- Entry trigger: The specific price level where the setup confirms (e.g., break above $148.40)
- Stop level: The structural invalidation point — the T3 or T4 low for a VCP, the handle low for a cup & handle, the relevant MA for a pullback setup
- Risk per share: Entry price minus stop price
- Position size: (Account equity × risk percentage) ÷ risk per share
- Target 1: First logical resistance — the prior swing high, a measured-move projection, or 1.5R to 2R minimum
- Target 2: Extended target at 2.5R to 3R for partial hold when the trade is working
Van Tharp (Trade Your Way to Financial Freedom, 2006) formalized this as the R-multiple framework: every position risks a predefined amount (R), and all results are measured as multiples of that amount. The framework converts an ambiguous "how much did you make?" into a precise system for evaluating whether a trading methodology is producing positive expectancy over time.
For the full position sizing math — how to calculate shares from account equity, stop distance, and risk percentage — see position sizing with R-multiples.
The Full Pre-Session Checklist
Run this checklist the evening after market close, before the next session:
Regime Check (5 minutes)
- ✅ S&P 500 above 200-day MA: confirmed
- ✅ Advance-decline line trending up over past 3–4 weeks
- ✅ New 52-week highs exceeding new 52-week lows
- ✅ VIX below 20 (or regime context acceptable for the grade threshold you're using)
- ❌ Do not screen for individual setups without completing the regime check — a Trending Down or High Volatility regime requires tighter grade thresholds or a pause in new longs
Universe Filter (10–30 minutes, or 30 seconds with a screener)
- ✅ Stage 2 structure: price above 50 > 150 > 200 MA, all three sloping upward
- ✅ RS rank 80+ (targeting 90+ for highest-conviction candidates)
- ✅ Stock within 25–30% of its 52-week high
- ✅ Relative volume (RVOL) on recent up-days above 1.0×
- ❌ Do not include stocks below the 200-day MA, regardless of any other characteristic
Pattern Evaluation (10–20 minutes)
- ✅ Count actual contractions — each must be measurably shallower than the previous
- ✅ Confirm volume declined through the consolidation (below 20-day average volume)
- ✅ Identify the specific pivot price — the resistance level the entry requires breaking
- ✅ Verify the stock is within 5% of the pivot (not already extended past the valid entry window)
- ❌ Do not force a pattern call on an ambiguous setup — if unsure whether it qualifies, it doesn't
Trade Plan (10–15 minutes per candidate)
- ✅ Entry price documented (specific trigger level)
- ✅ Stop price documented (structural level — not an arbitrary percentage)
- ✅ Risk per share calculated (entry minus stop)
- ✅ Position size calculated from the 1% rule
- ✅ Target 1 and Target 2 documented at logical resistance levels
- ❌ Do not enter any position without a written stop — the stop is what makes the position a structured trade rather than a speculation
How Much Time This Process Takes
With no automation, the full five-step process requires two to three hours per session — most of that spent on the Stage 2 and pattern-evaluation steps, reviewing individual charts across a 400–700 stock filtered pool. With a screener that handles the Stage 2 and RS filters, the same process takes 15–30 minutes.
| Step | Manual (no automation) | With a screener |
|---|---|---|
| Regime check | 15 minutes | 2–3 minutes |
| Stage 2 + RS rank filter | 60–90 minutes | 30 seconds |
| Pattern recognition | 30–60 minutes | 5–10 minutes |
| Trade plan writing | 15–25 minutes | 15–25 minutes |
| Total | 2–3 hours | 20–40 minutes |
The screening automation removes the mechanical work that doesn't require judgment. Pattern evaluation and trade plan writing require human decision-making. Reviewing 600 charts for Stage 2 structure does not.
For a workflow that converts screener output into an ordered daily candidate list — ranked by setup quality and proximity to the entry trigger — see the swing trading watchlist workflow.
The Role of Grade and Quality Thresholds
Not every setup that clears Stage 2, RS rank, and pattern requirements is equal. A VCP with three clean contractions, volume dried to 40% of average, RS rank at 95, and entry within 2% of the pivot is a different trade than a VCP with two loose contractions, inconsistent volume behavior, RS rank at 83, and entry at 4.8% above the pivot.
Experienced swing traders develop a personal quality threshold — a minimum confluence score they require before committing capital. That threshold adapts to the market regime. In a strong Trending Up regime, a B+ grade setup may be worth taking. In a Transitioning or Ranging regime, only A or A+ grade setups justify a full-size position.
Quality filtering is the mechanism that prevents a numerically correct process from producing a statistically weak trade log. The five steps above are the process for finding candidates. The grade threshold is the gate that controls which candidates become actual trades.
EasySwing.trading applies the five-step filtering process automatically each session — Stage 2 trend structure, RS rank screen, pattern detection, and market regime gating — across 2,000+ US equities, outputting A+/A/B+/B/C-graded candidates with pre-calculated entry, stop, and target levels. Combine the candidate list with the swing trading watchlist workflow to build your pre-session plan, and log each trade decision in the swing trading journal to track how your executed results compare to your setup expectations over time. Scan results are for informational purposes only. See our Risk Disclaimer.
Frequently Asked Questions
How many stocks should I screen when looking for swing trades?
After applying Stage 2 trend and RS rank 80+ filters, the eligible pool in a healthy bull market narrows to 60–150 stocks. From there, pattern recognition typically identifies 5–20 candidates with valid setups near an entry trigger. Entering more than 5–8 positions simultaneously as a retail swing trader dilutes attention and increases position management errors.
What is the best time of day to find swing trades?
The ideal time to find swing trade candidates is the evening after market close — not during the session. Evening review uses the completed daily candle for Stage 2 and pattern evaluation, has no emotional pressure from live price movement, and allows pre-writing trade plans before the next open. Pre-session decisions made without open P&L are significantly more disciplined than in-session decisions.
Do I need a stock screener to find swing trades?
A screener is not required, but it reduces the Stage 2 and RS rank filtering steps from 60–90 minutes of manual chart review to under one minute. The steps that require human judgment — pattern evaluation and trade plan writing — still take the same amount of time with or without automation. The screener eliminates mechanical review, not decision-making.
How do I know if a swing trade setup is worth entering?
A setup is worth entering when all five criteria are simultaneously met: the broad market is in a favorable regime, the stock is in Stage 2, its RS rank is 80 or above, the pattern is unambiguous with a defined pivot, and you have a written trade plan with entry, stop, and targets before placing any order. If any criterion is absent or unclear, the setup does not qualify.
How often should I look for new swing trades?
Most systematic swing traders complete the full five-step process once per session — the evening after market close, before the next trading day. New positions are only opened when the process produces candidates that meet all criteria. In strong trending markets, that might mean 3–5 new candidates per week. In Ranging or High Volatility regimes, the process might run but produce zero qualified candidates — and that result is correct and should be respected.
Disclaimer: This article is for educational purposes only and does not constitute investment advice. EasySwing is a stock screening tool, not a registered investment advisor. All trading involves risk. Read our full disclaimer →