EasySwing vs StockCharts: Which Technical Analysis Tool Fits Swing Traders?
William O'Neil's research on 600+ major stock market winners found that 95% showed a recognizable technical chart pattern before the start of their biggest price advances (How to Make Money in Stocks, 4th ed., 2009). StockCharts.com has served that pattern-reading discipline since 1999 — the SCTR ranking system, Relative Rotation Graphs, and SharpCharts are tools that serious systematic traders keep open daily. EasySwing.trading automates what comes after the charting session: the multi-factor detection layer that classifies named setups, assigns quality grades, and gates results by market regime before your morning review begins.
Both platforms are built for technical analysis. The difference is where pattern synthesis happens — and which step in the workflow each platform owns.
The Short Answer
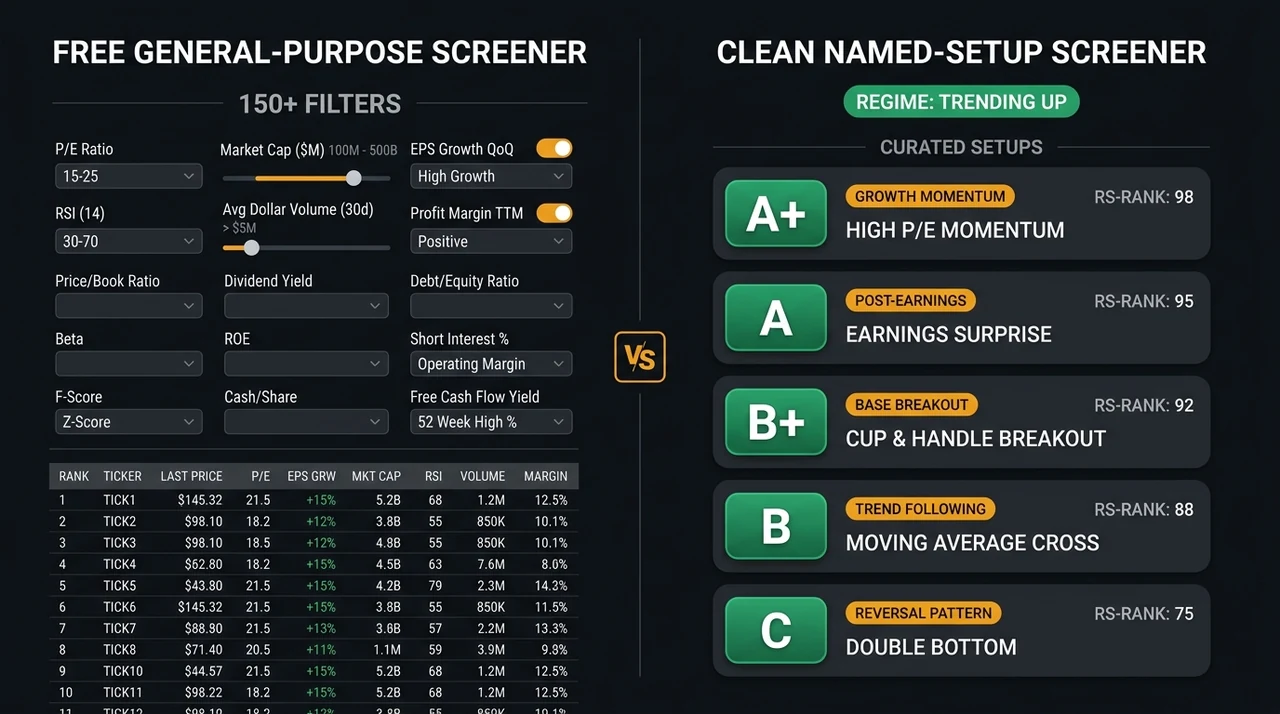
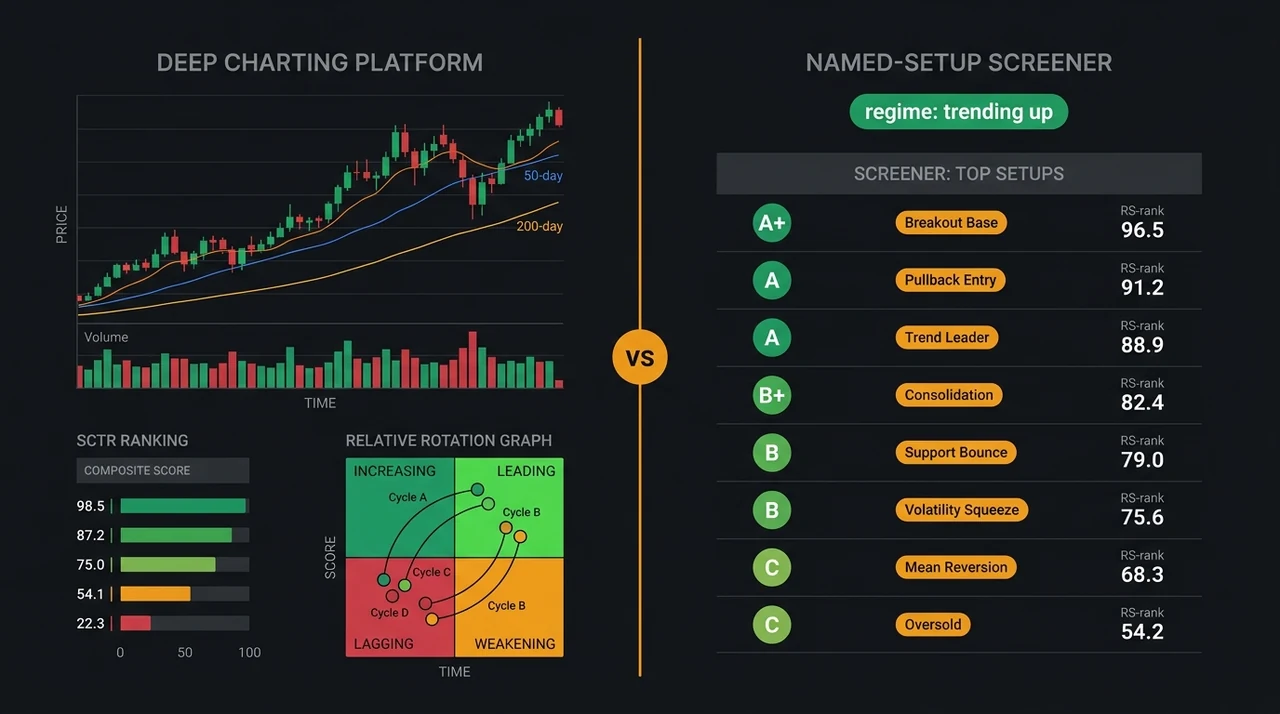
StockCharts is a deep charting platform: SCTR rankings, custom scan logic, P&F charts, Relative Rotation Graphs for sector rotation, and a broad market breadth library. EasySwing.trading is a named-strategy detector: 13 setup types graded A+/A/B+/B/C, with market regime filtering applied automatically after each session close. Most systematic swing traders use both — StockCharts for chart craft and breadth analysis, EasySwing for a pre-graded, regime-filtered candidate list delivered before the open.
| Feature | StockCharts | EasySwing.trading |
|---|---|---|
| Cost | Free to $49.95/mo | $49/mo ($39/mo annual) |
| Named setup detection | Manual (custom scan language) | Yes (13 strategies, automated) |
| Setup quality grading | No | Yes (A+/A/B+/B/C) |
| Market regime filter | No | Yes (5 states, updated daily) |
| SCTR ranking | Yes (proprietary composite) | No (uses RS rank) |
| Advanced charting | Yes (SharpCharts, ACP, P&F, RRG) | No |
| Relative Rotation Graphs | Yes | No |
| Custom scan language | Yes (proprietary syntax) | No (detection is pre-built) |
| Market breadth tools | Yes (BPI, McClellan, AD Line) | Partial (feeds regime signal) |
| Real-time data | Extra/Pro plans | No (end-of-day only) |
| AI coaching | No | Yes (Soren, per-setup) |
| US equities only | No (global coverage) | Yes |
What StockCharts Does Best
StockCharts.com predates nearly every other platform in the technical analysis category. Its core tools are mature, well-documented, and genuinely differentiated from generic charting software.
SharpCharts and the Advanced Charting Platform (ACP). StockCharts provides 200+ technical indicators and overlays, configurable in a clean browser interface. The charting engine supports annotation tools, multi-panel layouts, and saved templates that transfer between sessions. The P&F (Point & Figure) charting module deserves special mention: P&F analysis strips away time from the price axis and focuses purely on significant price movements, filtering out minor noise. Most platforms do not support P&F charts properly. StockCharts has supported them since its founding, and the P&F-based scan engine (which finds patterns like triple-top breakouts and bullish catapult formations) is available to paid subscribers.
SCTR (StockCharts Technical Rank). SCTR is StockCharts' composite technical score (0–100), calculated from six weighted inputs across three time horizons. Long-term inputs carry 60% of the score (percent above/below the 200-day EMA at 30% and the 125-day rate of change at 30%); medium-term inputs carry 30% (percent above/below the 50-day EMA at 15% and the 20-day rate of change at 15%); short-term inputs carry 10% (the 3-day slope of the PPO histogram at 5% and the 14-day RSI at 5%). An SCTR above 90 places a stock in the top 10% of technical momentum in its peer group by market cap. It is a transparent, well-designed metric for the systematic trader who wants a quick filter before going deeper on chart structure.
Relative Rotation Graphs (RRG). RRGs visualize which sectors and individual stocks are rotating into leadership versus fading into laggard territory. The X-axis measures relative strength trend (JdK RS-Ratio) against the benchmark; the Y-axis measures rate of change of that relative strength (JdK RS-Momentum). Stocks in the "Leading" quadrant (strong RS, strengthening momentum) are the primary hunting ground for swing setups. Stocks moving from "Improving" toward "Leading" are the emerging candidates. For swing traders running top-down analysis — sector first, then stock — RRG provides a canvas that no other charting tool replicates in the same format.
Market breadth library. StockCharts maintains one of the most complete collections of market breadth indicators available: Bullish Percent Index (BPI) by sector and index, the McClellan Oscillator and Summation Index, Advance-Decline Line and Volume, and New Highs-New Lows data going back decades. These are not standard features in most screeners and are valuable for confirming the macro environment before deploying capital in a new setup cluster.
Content community. StockCharts hosts a roster of practitioner contributors — including Greg Schnell, Tom Bowley, John Murphy, and others — who publish daily and weekly market analysis through the StockCharts blog and StockCharts TV. The educational depth of this community has no direct equivalent in the screener category.
What EasySwing Automates That StockCharts Cannot
StockCharts gives you the tools to build any analysis yourself. EasySwing pre-applies a specific detection and grading architecture and delivers results — the synthesis step happens server-side, not in your session.
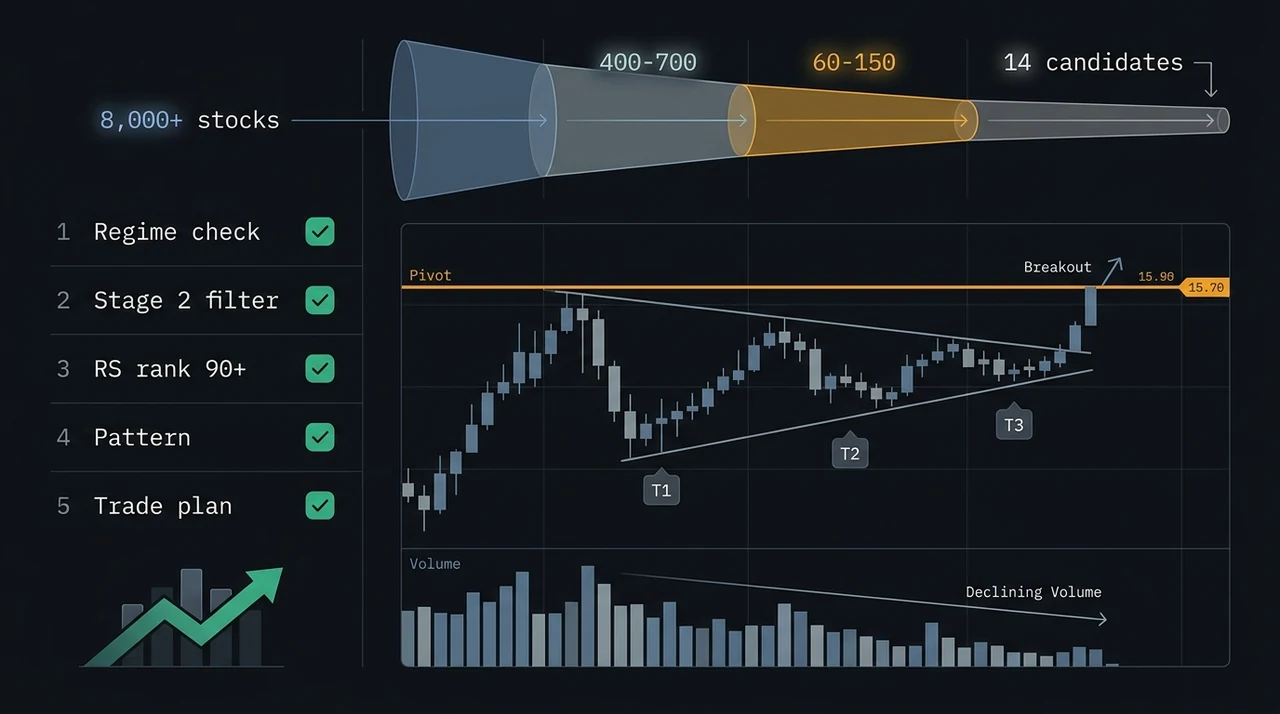
Named setup detection at universe scale. EasySwing detects 13 named strategies — VCP Breakout, Trend Pullback, Qullamaggie Breakout, ROC Breakout, HHV Breakout, MA Stack Confluence, and others — after every session close, across 2,000+ US equities. No scan language to write, no criteria to tune. Results are waiting in the morning.
To replicate EasySwing's VCP detection in StockCharts' scan engine, you would need to approximate successive contraction criteria using StockCharts' proprietary scan syntax — and even then, the scan returns stocks clearing a filter set, not stocks that have been classified against the full multi-condition VCP protocol (Stage 2 structure, RS rank gate, declining contraction sequence, volume dry-up, pivot proximity). Writing and maintaining your own named-setup scans in StockCharts is a real skill and a real time investment for traders who prefer not to make scan-building part of their workflow.
Mark Minervini describes the purpose of a screening process in Trade Like a Stock Market Wizard (2013): cut the evaluable universe from thousands to the handful of candidates worth real analytical attention. EasySwing applies 13 named strategy filters simultaneously after each session, returning only stocks that passed — pre-sorted by grade. Compared with building an equivalent scan set in StockCharts from scratch, the time-to-candidate shortlist is substantially different.
A+/A/B+/B/C quality grades. EasySwing's composite score evaluates every dimension of a named setup — RS rank position, volume confirmation, pattern geometry, trend structure — and assigns a single grade per result. Grade A+ means all factors are aligned to the highest standard simultaneously. Grade C means the base condition exists but confirming signals are weaker. SCTR is a composite momentum score across six indicators; it does not assess whether a stock is in a specific valid setup, or how strongly the setup's particular quality factors are aligned. The two metrics address different questions and are complementary rather than redundant.
Market regime gating. EasySwing classifies the broad market daily into one of five states using S&P 500 trend, ADX, breadth, and VIX data. Long-side momentum strategies — VCP, Qullamaggie, Trend Pullback — are gated out in Trending Down and High Volatility regimes; mean-reversion strategies surface more prominently when the regime calls for range-bound tactics. This classification applies automatically to every scan result: the shortlist you see reflects today's regime, not yesterday's. StockCharts provides the breadth indicators that inform this kind of read; EasySwing acts on those inputs without requiring you to check them manually before each session.
For the full five-state regime framework and how it affects strategy selection, see Market Regime: How to Read Bull, Bear, and Choppy Markets.
Soren AI coaching. EasySwing's built-in AI assistant, Soren, provides per-setup analysis on the setup card: what makes this instance notable, what the current regime implies for follow-through probability, and what to watch on entry. StockCharts does not include an AI layer within its charting or scan tools.
SCTR vs EasySwing Strategy Grades: What Each Measures
These are both ways to rank stocks technically, but they answer different questions.
SCTR answers: "How technically strong is this stock's price action overall, across multiple timeframes?" It is a cross-sectional ranking in a peer group — an SCTR of 90 means the stock is in the top 10% of its large-cap, mid-cap, or small-cap cohort on a composite momentum read. A stock can have SCTR 95 while forming an invalid base, while consolidating in a Stage 3 top, or while simply continuing a parabolic run. SCTR measures the historical price trajectory; it does not classify whether the current structure constitutes a valid named setup.
EasySwing strategy grade answers: "How complete and confluent is this specific named pattern?" A Grade A+ VCP means the setup meets the strictest interpretation of the VCP criteria — Stage 2 trend structure confirmed, RS rank gated, contraction sequence counted, volume dry-up confirmed, pivot proximity checked. The grade is setup-specific, not a general momentum assessment.
Using both in combination is more powerful than either alone. SCTR ≥ 85 narrows the universe to the top 15% of technical momentum leaders in their peer group. EasySwing's Grade A+ within that filtered set identifies the strongest specific setups among those leaders. The intersection is where the highest-probability candidates tend to cluster. For more on how RS rank functions in setup selection, see Relative Strength Rank: Why the RS 90 Score Identifies Market Leaders.
Who Should Use StockCharts
StockCharts is the right primary tool if you:
- ✅ Want deep charting with 200+ indicators, annotation tools, and saved templates
- ✅ Use P&F charts as part of your analysis methodology
- ✅ Run top-down sector analysis with Relative Rotation Graphs
- ✅ Want to build and maintain custom scan logic in a proven scan engine
- ✅ Use market breadth indicators — BPI, McClellan Oscillator, AD Line — as regime inputs
- ✅ Follow the StockCharts practitioner community for daily market perspective
- ✅ Need real-time intraday data alongside end-of-day analysis
- ✅ Are comfortable investing time in building your own setup scan library
Who Should Use EasySwing.trading
EasySwing.trading is the right primary tool if you:
- ✅ Want pre-built, validated named-strategy detection without scan coding
- ✅ Need a daily A+ candidate shortlist ready before your morning review
- ✅ Value quality grading over raw filter outputs — one grade per setup, not a filter count
- ✅ Want market regime context applied automatically to every scan result
- ✅ Find AI coaching on specific setups valuable in your review workflow
- ✅ Prefer a focused, opinionated workflow over a flexible general-purpose tool
- ✅ Use EasySwing via the MCP integration to surface candidates in conversation
- ❌ Do not need a charting platform — EasySwing surfaces setup candidates but does not include a charting module
The Workflow Most Systematic Traders Use
StockCharts and EasySwing.trading address different stages of the nightly swing trading process, which is why many systematic traders use both in a sequential workflow:
Step 1: EasySwing delivers the candidate list. After the session close, EasySwing's detection engine processes the 2,000+ equity universe against all 13 strategies. By evening, the Grade A+ shortlist — typically 4–8 candidates — is waiting in the dashboard. Market regime status is visible at the top: it tells you whether to trust momentum breakouts tonight or to treat any signal with more caution.
Step 2: StockCharts confirms chart structure. Pull each A+ candidate into StockCharts' ACP or SharpCharts. Check SCTR (look for ≥ 85 in the stock's peer group). Review the weekly chart to confirm Stage 2 structure and verify no significant weekly resistance lies directly above the daily pivot. Check the sector's position on the RRG — a setup in a sector rotating out of "Leading" into "Weakening" requires more caution than the identical setup in a sector transitioning from "Improving" into "Leading."
Step 3: Volume and breadth confirmation. Use StockCharts' volume analysis to confirm the daily volume pattern matches the detected setup type. For a VCP candidate, the chart should show declining volume through each contraction. Check the sector's BPI for breadth confirmation.
Step 4: Entry parameters from EasySwing's setup card. Use EasySwing's calculated entry level, ATR-based stop, and R-multiple profit targets as the trade parameters. These are already set when the candidate reaches Step 2 — the chart confirmation is verifying the setup quality, not recalculating the entry logic.
This workflow uses each tool in its strongest role: systematic detection and grading from EasySwing, deep chart validation and breadth context from StockCharts.
Pre-Trade Checklist for a StockCharts + EasySwing Workflow
Before acting on any EasySwing candidate, the StockCharts confirmation adds these layers:
- ✅ SCTR ≥ 85 in the stock's peer group (top 15% of momentum leaders)
- ✅ Weekly chart confirms Stage 2 trend structure (50W MA rising, price above it)
- ✅ No major weekly resistance directly above the daily pivot entry zone
- ✅ Sector RRG is in "Leading" or "Improving" quadrant, not "Weakening" or "Lagging"
- ✅ Volume pattern in SharpCharts matches the expected setup type
- ✅ Sector BPI is above 50% (breadth supports the entry)
- ❌ Skip if SCTR has been declining for 4+ weeks in a row — momentum fading
- ❌ Skip if sector RRG shows clear rotation into "Lagging" — sector headwind growing
For more on the indicators that feed EasySwing's detection engine and how to read them on a chart, see Best Indicators for Swing Trading: The 5 That Actually Work.
Key Takeaways
- StockCharts is the reference platform for chart craft: SCTR, P&F charts, Relative Rotation Graphs, market breadth tools, and a community of practitioner contributors going back to 1999
- EasySwing.trading automates the detection step: 13 named strategies, A+/A/B+/B/C quality grades, and market regime gating applied automatically after each session close
- SCTR and EasySwing strategy grades measure different things — SCTR is broad composite momentum across six inputs, strategy grades are setup-specific quality assessments — they are complementary, not redundant
- The most effective workflow uses both: EasySwing delivers the pre-graded candidate list, StockCharts provides deep chart validation and sector breadth context
- StockCharts wins on charting depth, real-time flexibility, custom scan power, and market breadth; EasySwing wins on named-setup synthesis, quality grading, regime-aware candidate delivery, and AI coaching
EasySwing.trading automatically detects 13 named swing trading strategies across 2,000+ US equities after each session — grading every result A+/A/B+/B/C and applying market regime filtering before the shortlist reaches you. For the strategy library behind the detection engine, see Swing Trading Strategies: A Practitioner's Guide. For a step-by-step walkthrough of how EasySwing's setup cards and alerts fit into a complete screening workflow, read How to Use EasySwing's Stock Screener for Swing Trading. Scan results are for informational purposes only. See our Risk Disclaimer.
Frequently Asked Questions
Does StockCharts have a stock screener?
StockCharts includes a scan engine with a proprietary scan syntax that lets users build custom technical conditions across its full equity universe. It does not include pre-built named swing trading setups. You define the scan criteria; StockCharts runs them. EasySwing's 13 named strategies — VCP, Qullamaggie Breakout, Trend Pullback, and others — run automatically each session without any user configuration.
What is the SCTR ranking in StockCharts?
SCTR (StockCharts Technical Rank) is a composite score from 0 to 100 that ranks stocks within their market-cap peer group based on six weighted technical inputs across three timeframes: the 200-day EMA proximity (30%) and 125-day rate of change (30%) for long-term, the 50-day EMA proximity (15%) and 20-day rate of change (15%) for medium-term, and the PPO histogram slope (5%) and 14-day RSI (5%) for short-term. A score above 90 places a stock in the top 10% of its peer group on composite technical momentum. SCTR measures overall price momentum, not whether a stock is in a specific named setup.
Can StockCharts identify VCP setups automatically?
StockCharts' scan engine can approximate parts of the VCP criteria using its proprietary scan syntax — price conditions, moving average relationships, and volume thresholds. Fully replicating the VCP detection logic requires coding the successive-contraction sequence, RS rank gate, volume dry-up confirmation, and pivot proximity check in that syntax. EasySwing applies the complete multi-factor VCP check automatically each session, including Stage 2 structure, declining contraction depth, and volume pattern, without custom configuration.
Does EasySwing.trading include charting tools like StockCharts?
EasySwing surfaces swing trading setup candidates with entry zones, ATR-based stop levels, and staged profit targets, but does not include a charting platform. Most users chart EasySwing candidates in StockCharts, TradingView, or ThinkorSwim after reviewing the daily A+ shortlist — using the setup card's entry and stop levels as the parameters and chart confirmation as the final validation step.
Is StockCharts worth paying for as a swing trader?
StockCharts' paid plans add real-time data, more saved ChartLists, additional scan runs per day, and access to the full indicator library without restrictions. For traders who use P&F charts, Relative Rotation Graphs, or SCTR as core tools, the upgrade is straightforward. Traders who primarily need a named-setup candidate list and quality grading — not a charting engine — may find that EasySwing covers that workflow more directly, with StockCharts' free tier sufficient for chart confirmation on the candidates EasySwing surfaces.
Disclaimer: This article is for educational purposes only and does not constitute investment advice. EasySwing is a stock screening tool, not a registered investment advisor. All trading involves risk. Read our full disclaimer →