How to Read a Stock Chart: A Swing Trader's Step-by-Step Guide
William O'Neil studied over 600 of the greatest stock market winners from 1880 through 2009. Every single one left a distinctive footprint on a price chart before its biggest move (How to Make Money in Stocks, 4th ed., 2009). Reading that footprint is the core skill that separates systematic swing traders from those who rely on tips or gut feel.
Learning how to read stock charts is a systematic skill, not an art: a stock chart review for swing trading takes 2-3 minutes per name once the framework is internalized. The goal is not to find "interesting" price action — it is to answer five questions in sequence: Is the trend intact? Is volume confirming? Is this stock outperforming the market? Is a named pattern forming? Does the market regime support entry? This guide covers each layer in the order you should apply them.
The Anatomy of a Stock Chart
A standard stock chart shows price on the Y-axis and time on the X-axis. Each candlestick represents one period — typically one trading day. Volume bars below the price panel show how many shares traded that day. Those two data streams — price action and volume — are the only inputs you need to identify trend direction, momentum quality, and institutional involvement.
The price panel (top) shows where the stock opened, hit its high, fell to its low, and closed each session. The candlestick body spans from open to close. The wick (or shadow) extends to the intraday high and low. A green or white candle closed higher than it opened. A red or black candle closed lower.
The volume panel (bottom) confirms whether price moves carry conviction. A high-volume up day signals institutional buying; a high-volume down day signals distribution. Volume that contracts during pullbacks and expands on breakouts is the signature of healthy institutional accumulation — the pattern that precedes most major moves.
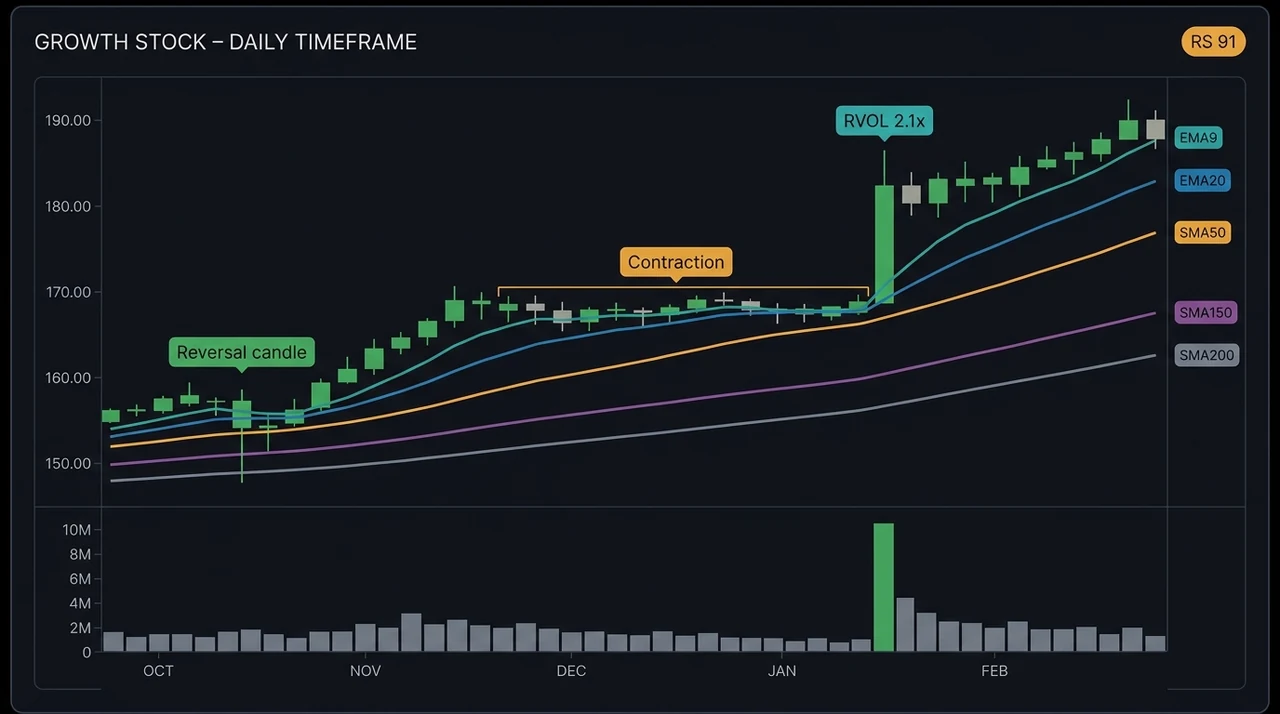
Most charting platforms also display moving averages overlaid on the price panel. The five most useful for swing trading are the EMA9, EMA20, SMA50, SMA150, and SMA200. Together they define what traders call the MA stack — a structural filter that identifies which phase of its lifecycle a stock is in.
Reading Trend Direction with the 5-MA Stack
A stock is in a Stage 2 advancing uptrend when price trades above a rising EMA20, the EMA20 is above a rising SMA50, and the SMA50 is above the SMA150 and SMA200, with all averages pointing upward. When the five moving averages are stacked in this sequence, the stock is in the structural environment where the highest-probability swing trades occur.
Stan Weinstein defined four stock lifecycle stages in Secrets for Profiting in Bull and Bear Markets (1988): base-building (Stage 1), advancing (Stage 2), top-forming (Stage 3), and declining (Stage 4). Swing traders want to own Stage 2 stocks exclusively. The advancing phase produces consistent higher highs and higher lows — the staircase pattern on a daily chart where each pullback finds support near the EMA20 or SMA50 before resuming the trend.
The five moving averages, in order of short- to long-term:
- EMA9 — the shortest-term trend; signals immediate momentum direction
- EMA20 — the core swing-trade trend filter; valid setups close above a rising EMA20
- SMA50 — the medium-term institutional participation line; pullbacks to SMA50 in an uptrend are high-probability entries
- SMA150 — the intermediate trend; confirms Stage 2 when trading above a rising SMA200
- SMA200 — the long-term trend direction; a rising SMA200 confirms Stage 2 structure
On a daily chart, a Stage 2 stock shows a clear staircase pattern: volume is generally heavier on up weeks than down weeks, and the moving averages fan out in order from EMA9 at the top to SMA200 at the bottom. For the full 5-MA framework, see moving averages for swing trading.
How to Read Candlestick Charts
Candlestick patterns reveal the battle between buyers and sellers within a single period. The most useful for swing trading are high-volume reversal candles that confirm trend continuation entries or signal setups approaching a trigger.
Lo, Mamaysky, and Wang (Journal of Finance, 2000) demonstrated that visual patterns in historical stock charts contain statistically significant predictive information after controlling for data-mining bias. Chart patterns are not subjective art — they reflect documented behavioral regularities in price action.
The four candlestick formations most relevant to swing traders:
- Hammer: Small body near the top of the session range, long lower wick. Buyers overwhelmed sellers by the close. Most useful at the base of a pullback in a Stage 2 uptrend.
- Bullish Engulfing: The current session's real body completely contains the prior session's body and closes higher. Signals buyers taking control following a down day — a strong reversal signal.
- Inside Bar: Current session's range falls entirely within the prior session's range. Signals volatility contraction — a potential coil before a directional expansion.
- High-Volume Breakout Candle: Large-bodied close near the session high on volume 1.5× or more above the 20-day average. The institutional signature of a legitimate breakout from a base or continuation pattern.
For all ten patterns and the trend context that makes each one work, see top 10 candlestick patterns for swing trading.
Volume: Confirming Every Price Move
Volume is the lie detector of a stock chart. A breakout on light volume can be reversed by a single institutional seller arriving the next morning. A breakout on 1.5× or 2× average volume reflects genuine institutional participation — buyers who committed real size, not retail speculators following a tip.
The metric to track is relative volume (RVOL) — the current session's volume divided by the 20-day average. RVOL above 1.5 on an up day signals above-average institutional activity. RVOL above 2.0 on a breakout candle is the strongest confirmation available.
Two volume patterns worth training your eye to recognize immediately:
Volume contraction in the base. As a stock forms a VCP, Bull Flag, or Cup & Handle, base volume should decline — especially on the later pullbacks. Volume contracting to 40-60% of average during the tightest contraction is the signature Minervini describes: sellers exhausted, buyers controlling the tape, the stock coiling before expansion.
Volume expansion on the trigger. The breakout candle should print RVOL 1.5× or higher. A close above the pivot on light or average volume suggests low-conviction movement — short-covering or thin-float drift rather than institutional accumulation. For the full RVOL framework and the three follow-through patterns that confirm real institutional buying, see volume analysis for swing trading.
Relative Strength: Your Stock Against the Market
A stock chart read in isolation misses the most important context: how is this stock performing compared to the broader market? A stock can trace a textbook Stage 2 uptrend on its own chart while actually underperforming hundreds of its peers. That relative weakness is a warning sign.
Relative Strength (RS) rank measures a stock's six-month price performance against the universe of tracked equities. An RS rank of 90 means the stock outperformed 90% of the market over the past six months. Jegadeesh & Titman (Journal of Finance, 1993) documented that the top decile of momentum stocks (highest relative strength) generates approximately 12% annual excess returns over the subsequent 12 months. That finding is the quantitative foundation for using RS rank as a required filter.
Mark Minervini wrote in Trade Like a Stock Market Wizard (2013) that virtually all of his biggest winners ranked in the top 20% of all stocks on relative price performance before their major advances. Checking the MA stack without checking relative strength is reading half the chart.
What RS rank signals on a practical level:
- RS 90+: market leader, the stock is outperforming 90% of equities — target zone for breakout setups
- RS 80-89: solid performer, acceptable for most setup families
- RS below 70 in a Stage 2 stock: structural trend intact but relative performance weak — pass unless the setup grade is exceptional
For the full methodology and how RS rank integrates with setup grading at EasySwing, see relative strength rank: why RS 90+ matters for swing traders.
Named Patterns: From Chart Reading to Entry Decision
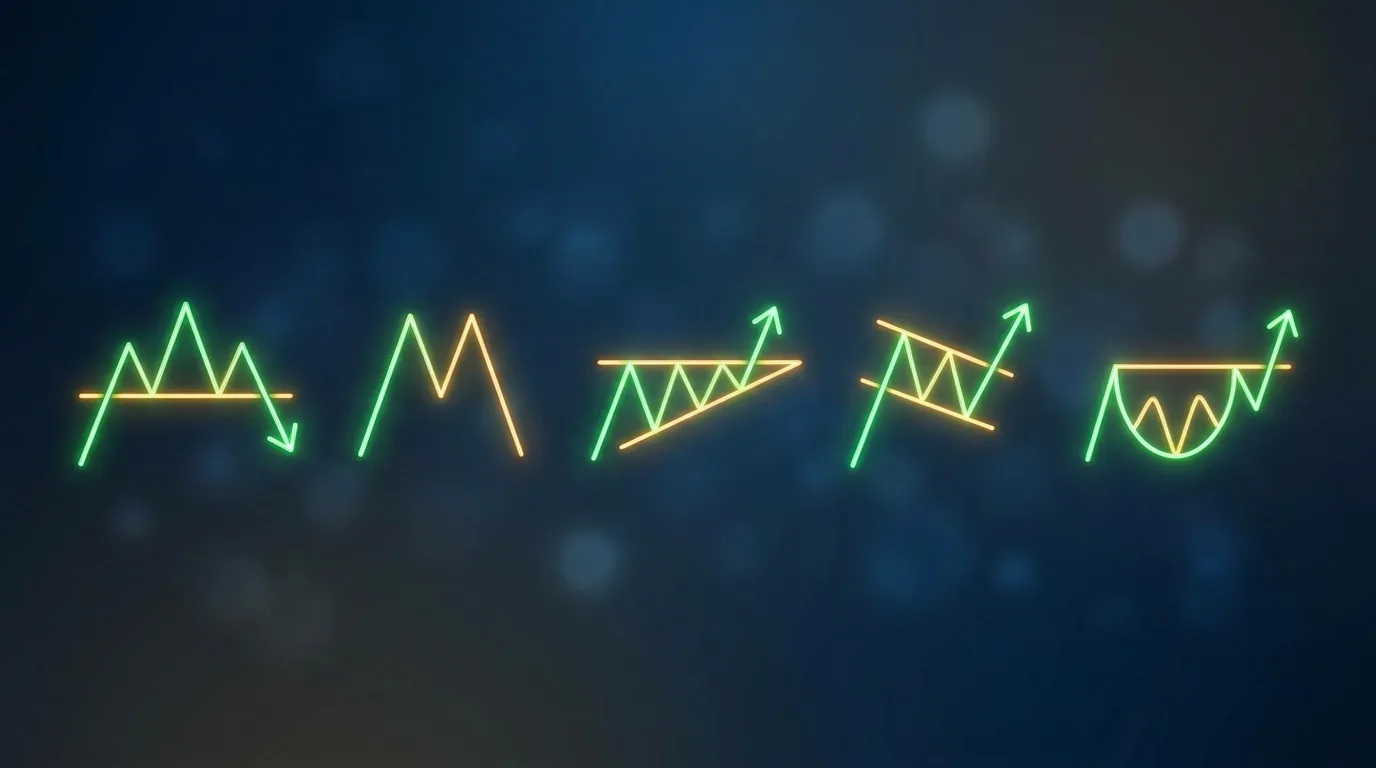
Reading chart structure tells you which stocks are positioned correctly. Named setup patterns tell you when to act. A VCP, Bull Flag, or Pullback-to-Rising-MA is not a visual shape — it is a defined set of measurable conditions that, when met simultaneously, produce a repeatable edge.
The four most consistent named patterns for US equity swing trades over 5-30 day holding periods:
- VCP (Volatility Contraction Pattern): Successive tightening contractions with declining volume, followed by a volume-expansion breakout above the pivot. Each contraction is narrower than the previous, volume dries up, then explodes on the trigger. Minervini's primary setup.
- Bull Flag: A sharp momentum leg (the pole) followed by a 5-15% pullback in a tight, orderly downward channel (the flag), then a breakout above the flag top on volume. Structurally a compressed cousin of the VCP — bull-flag structures typically surface through breakout and pullback screens rather than a dedicated scan. See bull flag pattern breakout setup for the complete entry checklist.
- Pullback to Rising MA: In a Stage 2 uptrend, a 3-8 day orderly pullback to the EMA20 or SMA50 followed by a confirmed reversal candle. Entry risk is lower than a breakout because the entry is within the established range, not at a new high.
- Cup & Handle: A 30-65% depth cup over 7-65 weeks, followed by a tight handle pullback no deeper than 8-12% on declining volume, then a breakout above the pivot.
A 5-Layer Daily Chart Review Checklist
The five-layer framework — trend check, volume check, RS rank, pattern identification, regime context — compresses to 2-3 minutes per name with practice. Apply each layer as a gate: failing any one layer ends the review.
- ✅Trend intact: Price is above a rising EMA20, EMA20 above rising SMA50, SMA50 above SMA150 and SMA200 — all pointing upward
- ✅Volume confirming: Base volume is declining (RVOL below 1.0 during pullbacks); breakout candles show RVOL 1.5× or higher
- ✅RS rank strong: Stock ranks 80 or higher vs the universe — outperforming the majority of the market
- ✅Named pattern forming: A specific, nameable setup is actively in progress — not "looks bullish," but "VCP with two completed contractions, volume drying to 40% of average"
- ✅Regime compatible: Current market regime (TRENDING_UP, RANGING, HIGH_VOLATILITY, TRENDING_DOWN, TRANSITIONING) supports the setup family you are entering
- ✅Pre-defined levels: Entry trigger, stop-loss level, and profit target (T1, T2) are identified and written down before the trigger fires
- ❌Buying a stock because it "looks like it might go up" — visual interest is not a setup criterion
- ❌Ignoring volume on the breakout candle — low-volume breakouts reverse at a high rate
- ❌Owning a Stage 3 or Stage 4 stock and waiting for a bounce instead of cutting
- ❌Reviewing only the daily chart and ignoring the weekly trend structure
- ❌Checking the MA stack but skipping RS rank — a Stage 2 stock underperforming the market is a laggard, not a leader
EasySwing.trading reads stock charts automatically for 2,000+ US equities at each session close, detecting 13 named swing trading setups and grading each result A+/A/B+/B/C by confluence quality. For the practitioner's framework that ties trend, volume, and RS together, see swing trading technical analysis and how to use the EasySwing stock screener. Scan results are for informational purposes only. See our Risk Disclaimer.
Frequently Asked Questions
What is the most important thing to look for on a stock chart?
Trend direction relative to the five key moving averages (EMA9, EMA20, SMA50, SMA150, SMA200). A stock in Stage 2 — price above all five averages, all pointing upward — is in the advancing phase where most profitable swing trades occur. Trend structure is the gate every other factor checks against.
How do I know if a breakout is real or a false move?
Three signals confirm a real breakout: price closes above the defined pivot level, relative volume (RVOL) is 1.5× or higher compared to the 20-day average, and the close is in the upper half of the day's range. Breakouts on average or light volume — especially where price closes mid-range or lower — reverse at a high rate within two to three sessions.
What is the difference between a stock's moving average trend and its RS rank?
Moving averages measure a stock's own price trend in absolute terms. Relative Strength (RS) rank measures that stock's performance against the broader universe of tracked equities. A stock can be above its moving averages (trending up) while still underperforming hundreds of its peers. High-probability swing setups pass both filters — Stage 2 structure plus RS rank above 80.
How long does it take to learn to read stock charts?
The five-layer framework — trend, volume, RS rank, pattern, regime — takes 2-4 weeks of daily chart review to become fluent with. The mechanical steps are straightforward; the skill is building the visual recognition to apply them quickly. Reviewing 20-30 charts per session using a defined checklist is the fastest path to fluency.
Do I need special software to read charts for swing trading?
Any platform that displays daily/weekly candlesticks, volume bars, and allows adding EMA9/20 and SMA50/150/200 supports the framework above. EasySwing.trading automates the five-layer review across 2,000+ US equities at session close, pre-detects 13 named setup patterns, and grades each result A+/A/B+/B/C — compressing the manual chart review into a daily automated scan.
Disclaimer: This article is for educational purposes only and does not constitute investment advice. EasySwing is a stock screening tool, not a registered investment advisor. All trading involves risk. Read our full disclaimer →