Trendlines in Swing Trading: How to Draw and Trade Them
Lo, Mamaysky and Wang (Journal of Finance, 2000) tested chart patterns on U.S. stocks from 1962 to 1996 and found that several of them carried incremental information about future returns. A trendline is a straight line drawn through a series of swing lows (uptrend) or swing highs (downtrend) that marks where price has repeatedly found support or resistance, and swing traders use it to time pullback entries and to spot when a trend is ending.
That sounds simple, and it is where most traders go wrong. Two points always make a line. Whether the line means anything depends on how many touches it has, how steep it is and how long it has held.
This guide covers how to draw a trendline that other traders are also watching, three ways to trade it, a worked example with arithmetic, and the mistakes that turn trendlines into wishful thinking.
How to Draw a Trendline on a Daily Chart
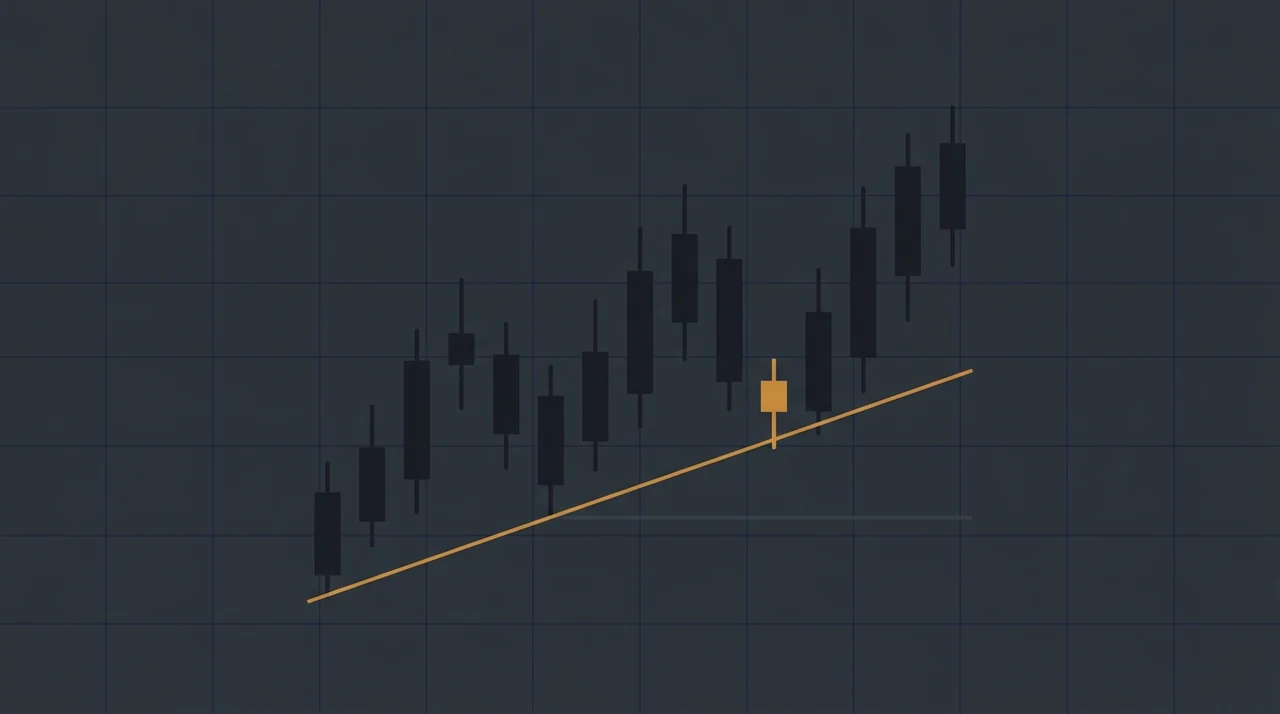
Draw an uptrend line under two or more rising swing lows, and a downtrend line over two or more falling swing highs. Use the daily chart for swing trades, then check the weekly chart for the larger line. A valid line slopes in the direction of the trend and does not cut through price bodies.
John Murphy, in Technical Analysis of the Financial Markets (1999), notes that two points are needed to draw a trendline and a third touch is needed to confirm it. That is the working standard most chartists use.
Follow these steps in order:
- Find the swing points. A swing low is a bar whose low is lower than the lows of the bars on either side of it. Mark at least two in an uptrend, with each one higher than the last.
- Connect the first and second swing lows. Place the line on the wicks or the closes, and stay with that choice for every line you draw.
- Extend the line forward. The extension is the part you trade. The history behind it only proves the line has worked before.
- Wait for a third touch. A line with two touches is a hypothesis. A third touch that holds turns it into a level other traders are likely to see.
- Redraw only after a real break. Adjusting the line to fit each new bar is curve-fitting, not analysis.
Use a logarithmic price scale for long trends in fast-moving stocks. On a linear scale, a stock that doubles looks like it is accelerating even when its percentage growth is steady, so a straight line drawn on it will be too steep to last.
What Makes a Trendline Valid: Touches, Slope and Duration
A trendline gets stronger with more touches, a moderate slope and a longer duration. A steep line drawn over a few days breaks easily and tells you little. A gradual line that has held for months, with four or five touches, is the one traders defend.
Edwards and Magee, in Technical Analysis of Stock Trends (1948), argued that the longer a trendline has held and the more often it has been tested, the more significant its eventual break. The same logic runs in the other direction: a line with few touches and a steep angle carries little weight either way.
| Feature | Weak line | Strong line |
|---|---|---|
| Touches | 2 | 3 or more, each at a clear swing low |
| Duration | Under 3 weeks | 2 months or longer |
| Slope | Steep, often above 45 degrees on a standard chart | Gradual, roughly in line with the 50-day average |
| Volume at touches | Heavy selling at the line | Volume dries up as price reaches the line |
| Fit | Cuts through bodies to catch more touches | Touches swing lows with little to no overlap |
Volume adds a second read. When price falls back to a rising line on shrinking volume, sellers are losing interest. When it falls to the line on rising volume, the line may be about to give way. The volume analysis guide covers how to read that contraction.
Three Ways to Trade a Trendline
Swing traders use trendlines three ways: buying a pullback to a rising line, buying the break of a falling line, and treating the break of a rising line as an exit warning. The first has the clearest risk, because the stop sits just beyond the line.
Pullback to a rising line
This is the most common use. In an uptrend, price returns to the line, stalls and turns up. The entry is a close or a break above the bounce bar's high, and the stop goes below the line with room for normal noise. If the line fails, the trade is wrong and the stop is hit at a known distance.
The structure matches the moving-average version of the same idea, covered in the pullback to a rising moving average guide. The line replaces the average as the level where buyers are expected.
Break of a falling line
A downtrend line over several lower highs marks where sellers keep stepping in. When price closes above it, the downtrend has at least paused. Most traders want a close beyond the line rather than an intraday poke, and many want volume above its recent average on the break day.
These breaks fail often when the larger trend is still down. Treat the trade as a lower-confidence entry unless the broader chart is also turning.
Break of a rising line as an exit warning
When a rising line that has held for weeks breaks on a close, the trend that justified the trade has changed. Many swing traders tighten a trailing stop or take profit on that signal. The trailing stops guide covers how to turn that into a rule.
A Worked Example With Arithmetic
A trendline trade is sized from the distance between entry and the stop placed beyond the line. The example below uses a hypothetical stock with illustrative prices, not a past trade, to show how the line value, the stop and the share count connect.
A stock makes swing lows of $50.00 (day 0) and $53.00 (day 10). The line between them rises $0.30 per day. A third swing low on day 18 touches the line at $55.40, and price bounces. The 14-day ATR is $1.20.
- Line value on day 18: $50.00 + (18 x $0.30) = $55.40
- Entry: $56.40, above the bounce bar's high
- Stop: $54.80, which is the line minus half an ATR ($55.40 - $0.60)
- Risk per share (1R): $56.40 - $54.80 = $1.60
- Reference targets: $58.80 (+1.5R) and $61.20 (+3R)
A position-size calculator turns those inputs into a share count. With a $25,000 account and 1% risk ($250), the sizing math gives $250 / $1.60 = 156 shares, rounded down. That is calculator output of the inputs above, not a recommendation to buy.
If the stock closes below $54.80, the line has failed and the loss is about 1R plus any gap slippage. The position sizing guide covers the R-multiple framework behind this arithmetic, and the stop loss guide covers where structural stops belong.
Trendline Mistakes That Cost Money
Most trendline failures come from drawing the line to fit a conclusion. The line should come from the chart first and the trade idea second. These are the mistakes that show up most often:
- Forcing a third touch. If the line has to cut through candle bodies to hit a third low, it is not a line.
- Using a steep line as support. A line steeper than the stock's normal pace is a speed limit, and price usually breaks it.
- Buying every touch without checking the trend. A line that has held five times in a stock that is losing momentum can fail on the sixth. Confirm the trend with the stage and moving averages, not the touch count alone.
- Ignoring the market backdrop. A clean line on a stock in a weak market is easier to lose, because a falling market tends to pull most stocks down with it. Check the market regime before relying on a stock-level line.
- Skipping the stop. A trendline is a reason for the entry. It is not a reason to hold through a close below it.
Trendlines Versus Moving Averages
A trendline is a subjective, hand-drawn level, while a moving average is a calculated one. Two traders can draw different lines on the same chart but will see the same 20-day EMA. That is why many systematic approaches define trend with averages and use trendlines as a visual check.
EasySwing does not draw trendlines. It defines trend with moving averages. The Weinstein stage check classifies a stock as Stage 2 when the close is above a rising 30-week (150-day) simple moving average, as explained in the Stage 2 guide. The trend-pullback setup requires the 9-day EMA above the 20-day EMA above the 50-day SMA, with the 50-day SMA rising over the last five bars, before it looks for a pullback toward the EMAs.
Every setup the scanner produces carries an entry, a stop and two targets (T1 and T2). The scanner also classifies the broad market as Trending Up, Trending Down, Ranging, High Volatility or Transitioning. A trendline you draw yourself can add a second opinion on where a stock is likely to find buyers. It does not replace the stop.
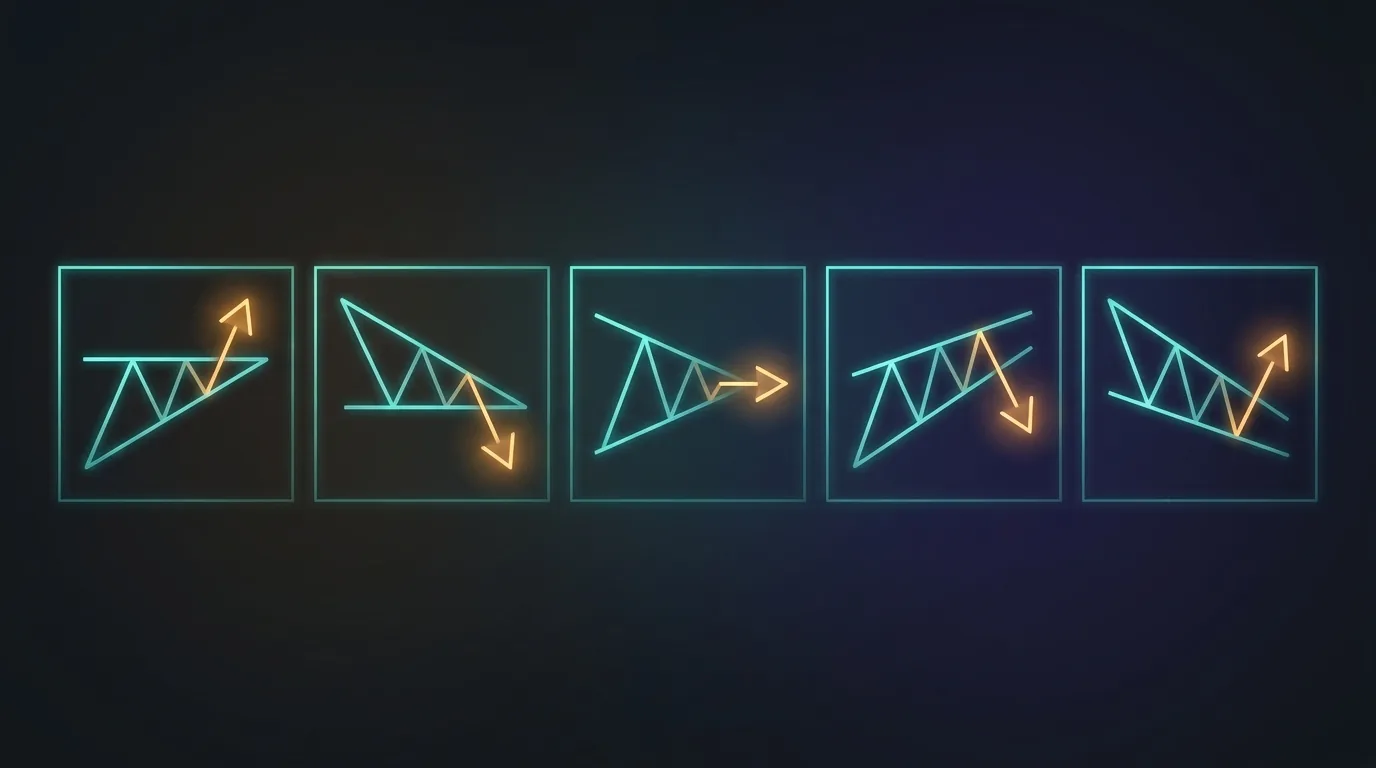
The support and resistance guide shows how horizontal levels and dynamic levels fit together, and the triangle and wedge guide shows what happens when a rising and a falling trendline converge.
Practical Trendline Checklist
- ✅Draw the line on the daily chart and confirm it against the weekly chart
- ✅Connect at least two swing lows (or highs) and wait for a third touch before trading the line
- ✅Use the same method, wicks or closes, for every line
- ✅Prefer a gradual slope over a steep one, and a long duration over a short one
- ✅Set the stop beyond the line with room for an ATR-sized buffer, and size the position from that distance
- ✅Check the market regime before trading a stock-level line
- ❌Do not move the line to catch more touches
- ❌Do not treat a two-touch line as confirmed
- ❌Do not trade a steep, short-lived line as support
- ❌Do not hold a position after a close below a line you used as the reason to buy
EasySwing screens for trend structure automatically using moving averages and stage analysis. For more on how levels fit together, see Support and Resistance in Swing Trading, and for the broader chart framework see How to Read a Stock Chart and Swing Trading Stop Loss. Scan results are for informational purposes only. See our Risk Disclaimer.
Frequently Asked Questions
How many touches does it take to confirm a trendline?
Two points draw the line and a third touch that holds confirms it. Lines with four or five touches over a period of months carry more weight, because more traders have seen and acted on them. A line with only two touches is a hypothesis, not a level to size a position around.
Should a trendline connect candle wicks or closing prices?
Either works if you apply the same method to every line. Wicks capture the full range and usually give the more conservative support level. Closes smooth out spikes and gaps. Pick one, write it into your rules, and judge breaks by the daily close rather than an intraday poke.
How do you tell when a trendline has really broken?
A daily close beyond the line, ideally on above-average volume, is the common standard. A wick through the line that closes back inside it is usually a test, not a break. Longer lines with more touches give more significant signals when they fail, and a stop beyond the line decides the trade either way.
Do trendlines work better on log or linear charts?
Log scale is better for long trends in fast-moving stocks, because it shows equal percentage moves as equal distances. On a linear scale a steady percentage climb curves upward and a straight line drawn on it will be too steep. For short, narrow-range trends over a few weeks, the two scales look almost identical.
Is a trendline better than a moving average for finding entries?
They answer the same question differently. A moving average is calculated, so everyone sees the same level, while a trendline depends on where you draw it. Many traders use a moving average to define the trend and a trendline as a second view on where a pullback may find buyers.
Disclaimer: This article is for educational purposes only and does not constitute investment advice. EasySwing is a stock screening tool, not a registered investment advisor. All trading involves risk. Read our full disclaimer →