Chart Patterns: The Complete Guide for Swing Traders
Thomas Bulkowski's bull-market perfect-trade studies report that a confirmed inverse head-and-shoulders bottom met its price target 71% of the time, while an Adam & Adam double top met its target 64% of the time and had a 25% break-even failure rate. These historical results are methodology-specific, not forecasts for individual trades. Chart patterns are not interchangeable: each has its own confirmation and target conventions. This guide organizes the major reversal and continuation patterns into one reference, with links to the full deep dive on each.
Chart Patterns, Defined
A chart pattern is a recurring price structure — a specific arrangement of peaks, troughs, or trendlines — that historically precedes a continuation or reversal of the prevailing trend often enough to be tracked statistically. Edwards and Magee's 1948 Technical Analysis of Stock Trends first codified the standard taxonomy still used today; Bulkowski's Encyclopedia of Chart Patterns (3rd ed., 2021) later put empirical failure rates and average moves behind each named shape.
A pattern only becomes tradeable once it's confirmed — a shape mid-formation is not a signal, and most patterns fail or reverse before completing. The two questions that matter for any pattern are: which family does it belong to (reversal or continuation), and what does the tracked data say its actual base rate is once confirmed.
Reversal vs. Continuation: The Two Pattern Families
Every chart pattern belongs to one of two families, and confusing them is the single most common chart-reading mistake. A reversal pattern signals the prior trend is ending; a continuation pattern signals a pause before the prior trend resumes. Reading a continuation pattern as a reversal (or vice versa) inverts the trade.
Reversal patterns require an established prior trend to reverse — a head-and-shoulders top needs a genuine uptrend behind it, not a flat, directionless chart. Continuation patterns require an established prior trend to continue — a bull flag needs a real pole, not a random consolidation. Context, not just shape, is what turns a set of peaks and troughs into a valid signal.
| Pattern | Family | Directional Bias | Bulkowski Sample | Avg Move | Meets Target |
|---|---|---|---|---|---|
| Head-and-Shoulders Top | Reversal | Bearish | 2,800+ | -16% | 51% |
| Inverse Head-and-Shoulders | Reversal | Bullish | 3,197 | +45% | 71% |
| Double Top | Reversal | Bearish | 1,114 | -15% | 64% |
| Double Bottom | Reversal | Bullish | 1,154 | +39% | 73% |
| Ascending Triangle | Continuation | Bullish (63% of the time) | 1,400+ | +43% | 70% |
| Descending Triangle | Continuation | Bullish (53% of the time) | 1,300+ | +38% | 64% |
| Flag, upward breakout | Continuation | Bullish | See source | +9% | 46% |
| Flag, downward breakout | Continuation | Bearish | See source | -8% | 46% |
| Cup and Handle | Continuation (base) | Bullish | 1,044 | +34% | 61%* |
*Cup and Handle's 61% is Bulkowski's overall pattern success rate rather than the meets-target metric used for the others — see the full post for the distinction.
The Reversal Patterns: Head-and-Shoulders and Double Top/Bottom
Reversal patterns mark the end of a trend, not a pause inside one — and the data shows the bullish (bottoming) variant of each reliably outperforms its bearish (topping) counterpart.
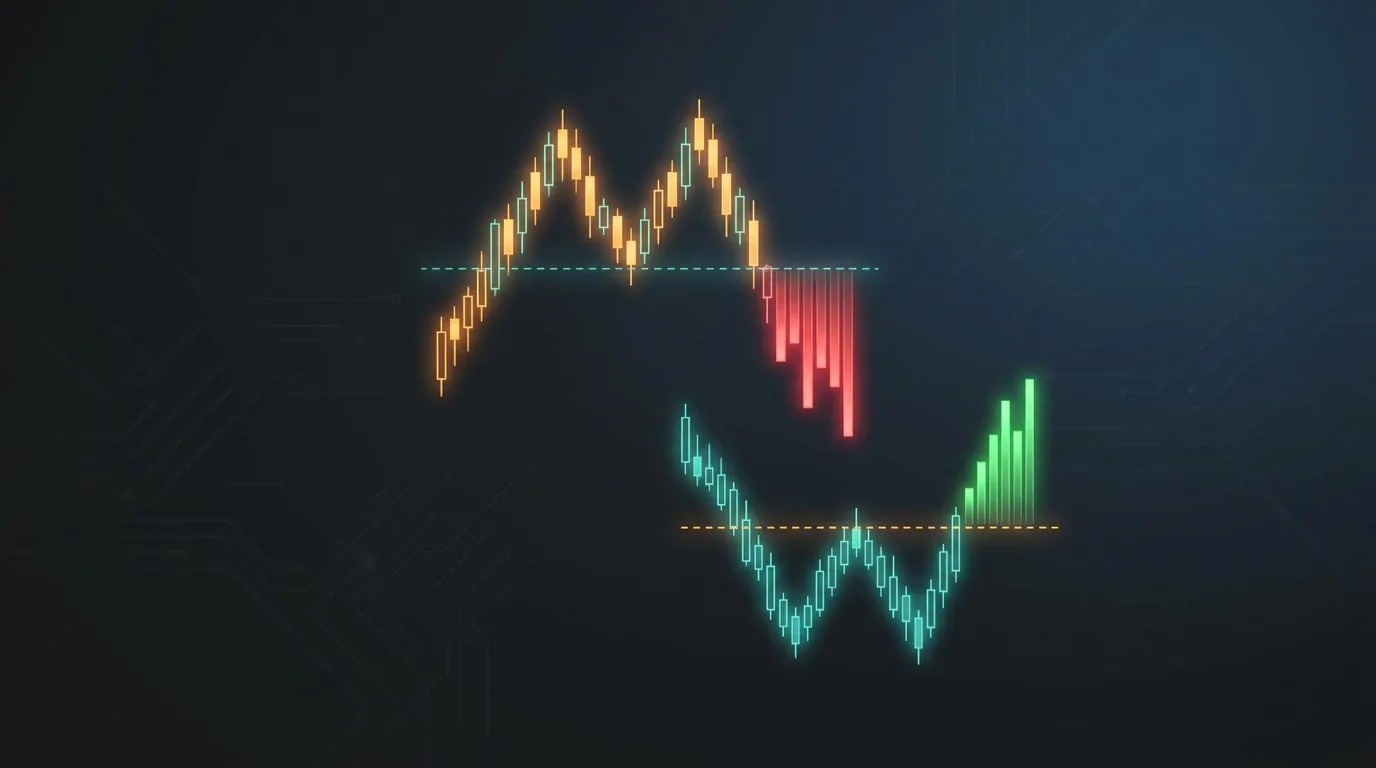
The head-and-shoulders is three peaks — a left shoulder, a higher head, and a right shoulder that fails to exceed the head — connected by a neckline. Its inverse marks a bottom instead of a top. Bulkowski's separate studies report an 11% break-even failure rate versus 19% for tops, and a 71% target-met rate versus 51%; the two variants still rank within different comparison groups.
The double top and double bottom is the simpler two-peak or two-trough version of the same reversal logic, classified by Bulkowski into "Adam" (narrow, spike-like) and "Eve" (wide, rounded) shape variants. The asymmetry is even wider here: a double bottom's 16% failure rate and 39% average rise clearly outperform a double top's 25% failure rate and 15% average decline.
Both patterns require a daily close beyond the neckline to confirm — a wick-only touch is not a completed pattern, and Bulkowski's data shows unconfirmed twin-peak shapes fail roughly 60-65% of the time.
The Continuation Patterns: Flags, Pennants, Triangles, and Cup and Handle
Continuation patterns are pauses, not endings — a strong move exhausts short-term buyers or sellers, price consolidates while the market digests the move, then the dominant side returns and the prior trend resumes.
Bull flags and bear flags pair a sharp pole with a short parallel channel that typically slopes against the pole. In Bulkowski's bull-market flag study, upward breakouts had a 44% break-even failure rate, a 9% average rise, and a 46% target-hit rate; downward breakouts had a 45% failure rate, an 8% average decline, and the same 46% target-hit rate. Those figures do not support calling flags the most reliable continuation pattern.
Flags and pennants look almost identical but are not equally reliable — a pennant swaps the flag's parallel channel for a converging triangle, and Bulkowski's tracked data shows pennants break upward only 57% of the time, with 54% of those upward breaks failing to even clear a 5% break-even threshold. The shape looks the same from a distance; the reliability gap is real.
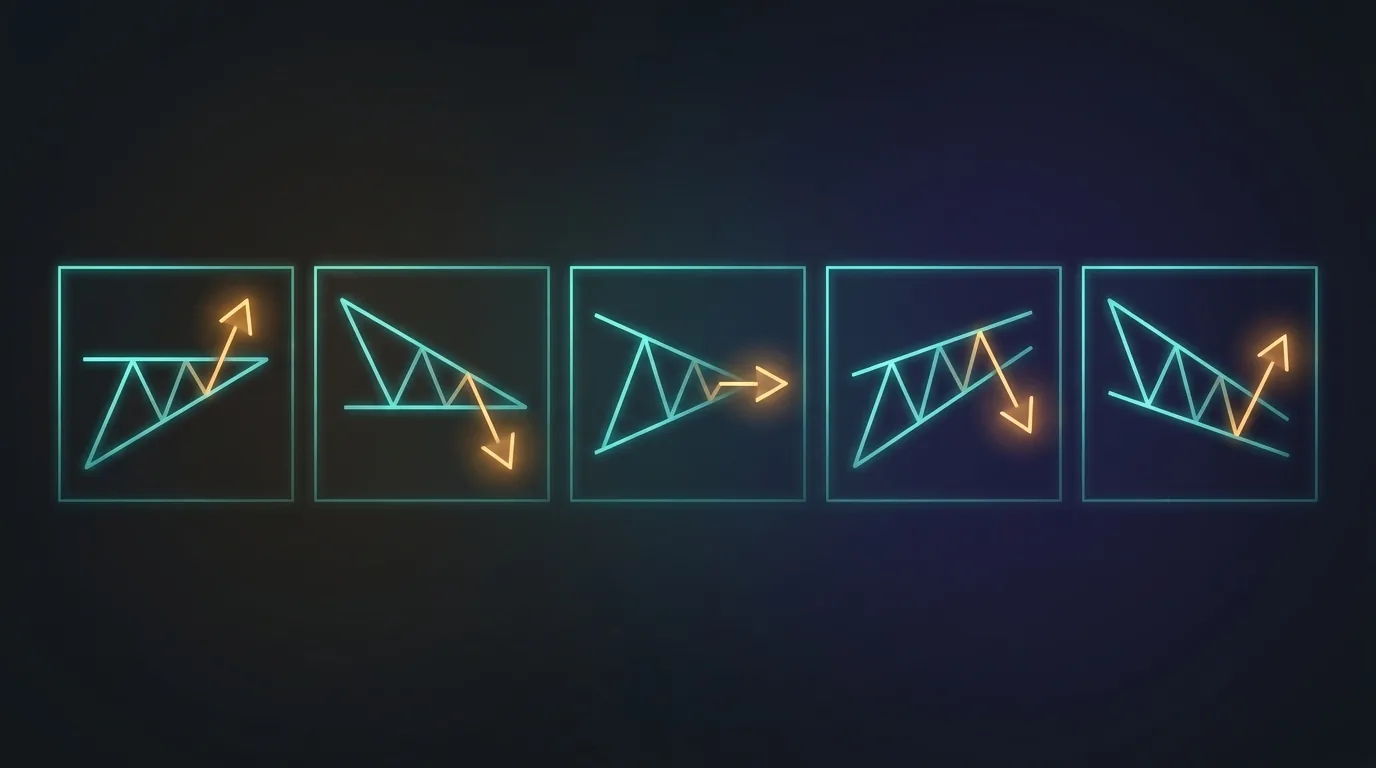
Triangles and wedges compress volatility toward a point via converging trendlines. The counterintuitive finding: a confirmed descending triangle — a name that sounds bearish — actually breaks upward 53% of the time in Bulkowski's data, while the ascending triangle breaks upward 63% of the time with a stronger 70% target-met rate on the way up.
The cup and handle, identified by William O'Neil, is a U-shaped base followed by a short, tight pullback before a breakout to new highs. Bulkowski's Encyclopedia of Chart Patterns reports a 61% overall success rate and a 34% average gain across 1,044 historical samples; that success-rate definition is not the same as the target-hit column used for the other rows.
Chart Patterns vs. Candlestick Patterns
Chart patterns and candlestick patterns both use price shape to read supply and demand, but they operate on different timeframes and answer different questions.
A chart pattern forms over weeks to months and describes the structure of an entire trend or consolidation — a head-and-shoulders or a triangle is a multi-week story. A candlestick pattern is a one-to-five-day sequence describing a single short-term shift in the auction between buyers and sellers. Both are useful, but a hammer candle confirming a bounce inside a larger cup-and-handle base is a different, complementary signal — not a substitute for the larger structure.
Measuring a Price Target
Many chart patterns use a measured move, but the measurement depends on the pattern: pole height for a conventional flag or pennant projection, head-to-neckline distance for head-and-shoulders and double top/bottom patterns, and the widest point for a triangle. Project the relevant distance from the confirmed breakout point in the breakout direction.
The geometry is similar, not identical, and Bulkowski sometimes tests an adjusted measure rule rather than a full textbook projection. Target-hit percentages should therefore be compared only after checking the source page's definition and study method; they are not direct position-sizing instructions.
Stop placement follows the structure: beyond the pattern's most recent swing point against the trade — above the right shoulder for a head-and-shoulders short, below the flag's lower trendline for a bull flag long.
Regime Dependence
No chart pattern should be assessed independently of the broader market regime. EasySwing reports five categorical states — Trending Up, Trending Down, Ranging, High Volatility, and Transitioning — from market-level inputs. They are not a linear Strong Bull-to-Strong Bear scale, and Transitioning does not specify a direction.
- Trending Up: Bullish continuation patterns (bull flag, ascending triangle, cup and handle) carry the most weight — the pattern confirms momentum already present in the broader tape.
- Trending Down: Bearish continuation and reversal patterns (bear flag, head-and-shoulders top) carry the most weight for the same reason, mirrored.
- Ranging: Every pattern appears more often and means less. A triangle or flag inside a sideways range is frequently chop, not a genuine setup.
- High Volatility: Necklines and trendlines get noisier, false breaks increase, and volume confirmation becomes more important across every pattern in this guide.
- Transitioning: Signals are mixed or inputs are incomplete; the direction-neutral label does not predict which way a pattern will break.
A pattern that completes against the broader regime — a head-and-shoulders top forming while the market is still firmly Trending Up — is a lower-conviction signal than the same shape completing alongside deteriorating relative strength rank and a broader regime rollover.
How EasySwing Relates to Chart Patterns
EasySwing does not expose a universal chart-pattern classifier. In particular, Bull Flag is not a named EasySwing strategy or detector.
Bear Flag is a registered detector with a dead evidence verdict and is excluded from picks. Cup and Handle is registered but currently inconclusive, so it is also excluded; it should not be called retired or dead. Trend Pullback and VCP Breakout use their own rules and do not classify arbitrary visual chart patterns. Check the performance page for current evidence and strategies for currently surfaced setups.
Practical Checklist
Before treating any shape on a chart as a confirmed pattern, verify these conditions:
- ✅Identify the family first — reversal or continuation — before reading the shape's implication
- ✅Confirm the pattern formed after a genuine prior trend, not inside a flat, directionless chart
- ✅Wait for a daily close beyond the neckline or trendline — a wick-only touch is not confirmation
- ✅Check that volume expands on the breakout relative to the pattern's quiet consolidation phase
- ✅Use the measured-move technique to set a target, and size the stop off the pattern's structure
- ✅Weigh the pattern against the broader market regime before assuming it will resolve as named
- ❌Do not assume a pattern's name predicts its breakout direction — descending triangles break up 53% of the time
- ❌Do not treat bullish and bearish variants of the same pattern as symmetric in reliability — the data rarely supports that
- ❌Do not confuse a multi-week chart pattern with a one-to-five-day candlestick pattern — they answer different questions
- ❌Do not chase a breakout that has already traveled most of its measured-move distance before you can enter
Frequently Asked Questions
What are the main types of chart patterns in stock trading?
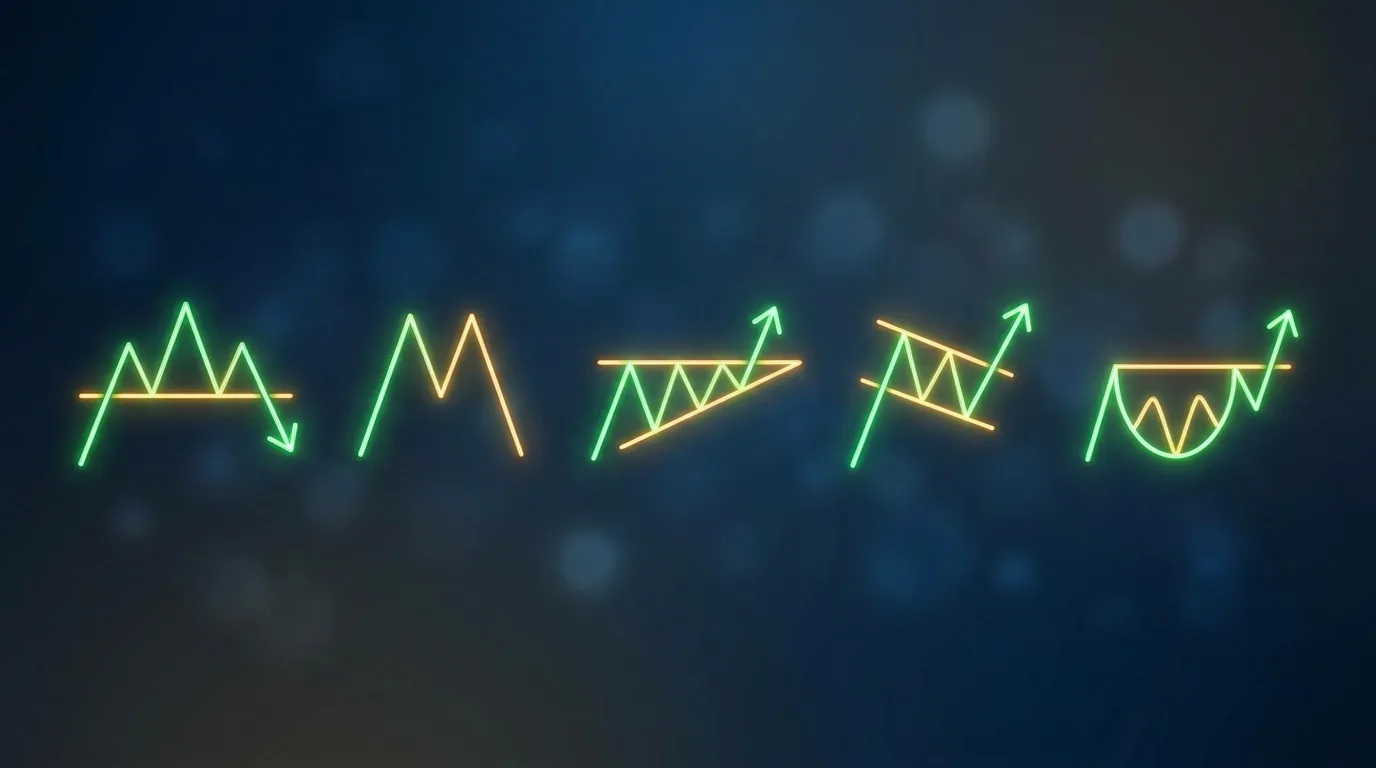
Chart patterns split into two families: reversal patterns (head-and-shoulders, double top/bottom), which signal a trend is ending, and continuation patterns (flags, pennants, triangles, wedges, cup and handle), which signal a pause before the prior trend resumes. Each pattern within those families has its own Bulkowski-tracked failure rate and average move.
What is the most reliable chart pattern?
Bulkowski's bull-market perfect-trade study reports that the inverse head-and-shoulders bottom met its price target 71% of the time with an 11% break-even failure rate across 3,197 samples. The ascending-triangle study reports a 70% upward target-hit rate and a 17% failure rate. These are source-specific historical comparisons, not a universal ranking.
What's the difference between a reversal and a continuation pattern?
A reversal pattern (head-and-shoulders, double top/bottom) signals the prior trend is ending and a new one is beginning. A continuation pattern (flag, pennant, triangle, cup and handle) signals a temporary pause before the prior trend resumes in the same direction. Reading one as the other inverts the trade.
How do you measure a price target from a chart pattern?
Take the vertical distance the pattern spans — pole height for a flag, head-to-neckline distance for a head-and-shoulders or double top/bottom, the widest point for a triangle — then project that same distance from the breakout point in the breakout direction. The technique is consistent across patterns; only the historical odds of reaching that target differ by pattern type.
Does EasySwing screen for chart patterns automatically?
There is no universal chart-pattern classifier, and Bull Flag is not a named EasySwing detector. Bear Flag has a dead evidence verdict and Cup and Handle is inconclusive, so both are excluded from picks. Active detectors such as Trend Pullback and VCP Breakout use their own rules rather than classifying arbitrary visual patterns.
EasySwing.trading provides market-regime and relative-strength context and scans for its own named setups; it does not provide a universal chart-pattern classifier. For the full breakdown of each pattern, see Head and Shoulders, Double Top and Double Bottom, Flag and Pennant Patterns, and Triangle and Wedge Patterns. Scan results are for informational purposes only. See our Risk Disclaimer.
Disclaimer: This article is for educational purposes only and does not constitute investment advice. EasySwing is a stock screening tool, not a registered investment advisor. All trading involves risk. Read our full disclaimer →