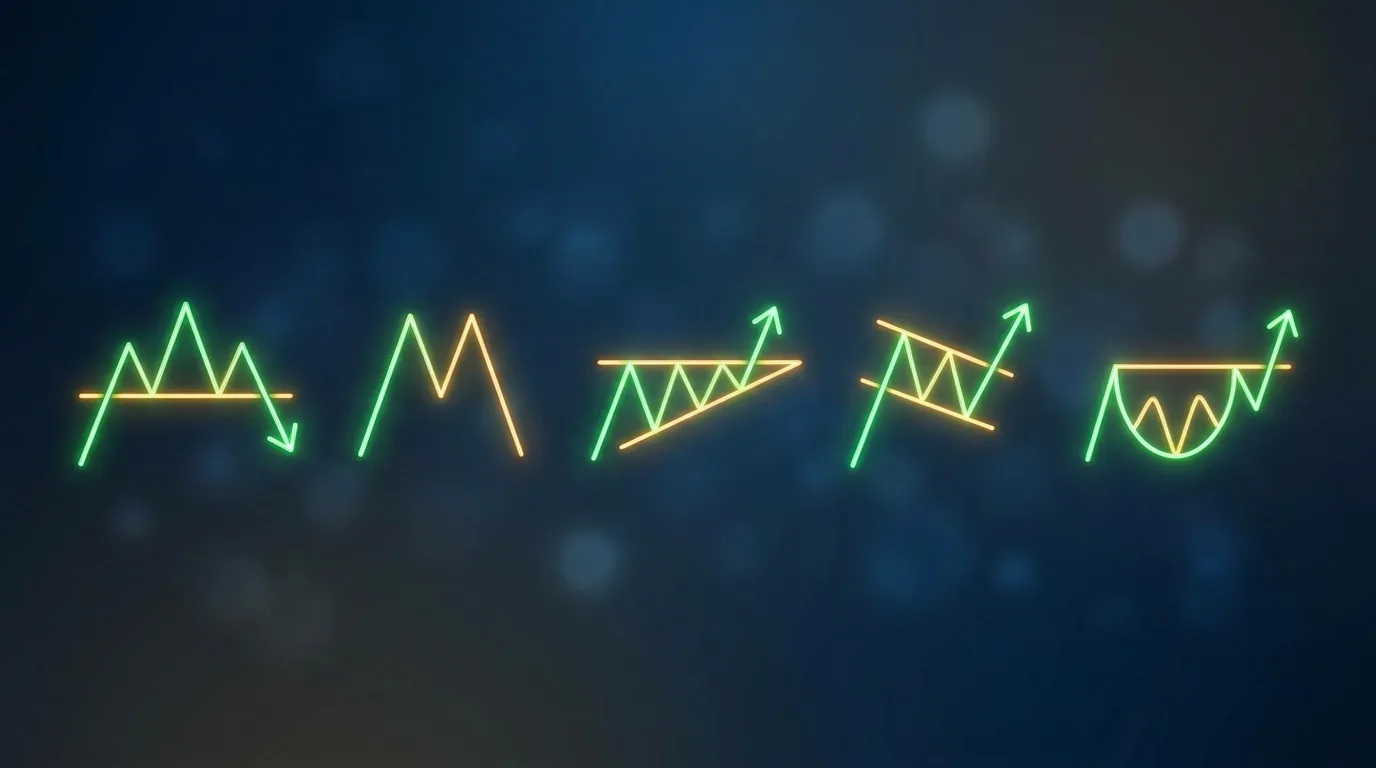
Head and Shoulders Pattern: How to Trade the Reversal
In Thomas Bulkowski's bull-market perfect-trade study, more than 2,800 head-and-shoulders tops had a 19% break-even failure rate, a 16% average decline, and a performance rank of 9 out of 36 patterns. His separate study of head-and-shoulders bottoms reported stronger failure, average-move, and target-hit results, although its performance rank was 13 out of 39. These are historical study results under Bulkowski's methodology, not a forecast for any individual trade. This guide covers the anatomy of both variants, the conventional measured target, and how to assess them alongside EasySwing's current market-regime context.
The Head-and-Shoulders Reversal Pattern, Explained
A head-and-shoulders is a reversal pattern: three successive price peaks where the middle peak (the head) rises higher than the two flanking peaks (the shoulders), connected by a support line (the neckline) drawn under the two reaction lows between them. A confirmed break of the neckline signals the prior uptrend has reversed into a downtrend.
The pattern only qualifies as a head-and-shoulders when all three peaks form during an existing uptrend — it is a topping pattern, not a starting-from-nowhere shape. A three-peak structure that appears in a flat, directionless stock is noise, not a signal. Context (an established prior advance) is what turns the shape into a reversal read.
Anatomy: Left Shoulder, Head, Right Shoulder, Neckline
Each of the pattern's four components does a distinct job, and skipping any one of them is the most common reason traders misread a normal pullback as a completed reversal.
- Left shoulder: Price rallies to a high on the existing uptrend's momentum, then pulls back. At this point the chart looks like any other pullback in an advance — nothing distinguishes it yet.
- Head: Price rallies again, this time to a new high above the left shoulder, then pulls back to a low near (or slightly below) the first pullback's low. This is the first hint of trouble: the advance made a higher high, but volume and follow-through on the new high are typically weaker than on the head's approach.
- Right shoulder: Price rallies a third time but fails to reach the head's high — the clearest tell that buying pressure is fading — then pulls back toward the neckline.
- Neckline: The line connecting the two reaction lows (the pullback lows after the left shoulder and the head). It can slope up, down, or run flat; a down-sloping neckline is generally read as a weaker underlying trend heading into the pattern.
Confirmation requires a daily close below the neckline, ideally on volume that expands relative to the quiet right-shoulder pullback. A neckline touch without a closing break is not a confirmed pattern — it's still forming.
The Inverse Head-and-Shoulders (Bottom)
The inverse head-and-shoulders is the mirror image: three successive troughs with the middle trough (the head) lower than the two flanking troughs (the shoulders), connected by a resistance neckline above. A confirmed close above the neckline signals a downtrend has reversed into an uptrend.
Bulkowski's bull-market perfect-trade data on 3,197 head-and-shoulders bottoms reports an 11% break-even failure rate (versus 19% for tops), an average rise of 45% (versus a 16% average decline for tops), and 71% of patterns meeting their measured price target (versus 51% for tops). The throwback rate — price returning to retest the neckline after the breakout, before continuing — is 65% for bottoms. The figures come from Bulkowski's bottom and top studies and should be read within that methodology.
| Metric | Head-and-Shoulders Top | Head-and-Shoulders Bottom |
|---|---|---|
| Sample size (Bulkowski) | 2,800+ patterns | 3,197 patterns |
| Break-even failure rate | 19% | 11% |
| Average move | -16% decline | +45% rise |
| Meets price target | 51% | 71% |
| Overall performance rank | 9 of 36 | 13 of 39 |
| Pullback/throwback rate | 68% | 65% |
In those studies, the bottom had better failure, average-move, and target-hit figures, while the top ranked higher within its separate comparison group. That does not by itself justify a larger position: sizing still depends on the entry, stop distance, account risk, liquidity, and the trader's own rules.
Measuring the Price Target
The standard measuring technique is the same for both variants: take the vertical distance from the head's extreme (the peak for a top, the trough for a bottom) to the neckline, then project that same distance from the breakout point in the breakout direction.
For a top: measure from the head's high down to the neckline directly below it, then subtract that distance from the neckline price at the point where price closes below it. For a bottom: measure from the head's low up to the neckline directly above it, then add that distance to the neckline price at the breakout point. Some traders use a more conservative target — the distance from the right shoulder's extreme to the neckline — for scaling out part of a position before the full head-to-neckline projection is reached.
Stop placement follows the same logic as any breakdown or breakout trade: above the right shoulder's high for a short entry on a confirmed top, below the right shoulder's low for a long entry on a confirmed bottom.
Head-and-Shoulders vs. Other Reversal and Basing Patterns
The head-and-shoulders is a reversal pattern, which puts it in a different category than continuation structures like the bull flag or basing patterns like Cup and Handle — those signal a pause inside a trend, not a change of trend direction. The closest structural relative is the double top or double bottom, which uses the same neckline-and-breakout logic but with two peaks or troughs instead of three; Bulkowski's data generally ranks the head-and-shoulders slightly ahead of the double top on reliability, largely because the middle peak's failure to hold makes the exhaustion signal clearer.
An inverse head-and-shoulders bottom and a Cup-and-Handle base share a similar practical role — both mark the transition from a prior downtrend or consolidation into a new advance — but their shapes and measuring rules are distinct, and conflating the two produces a wrong target calculation.
Regime Dependence
Neither variant should be assessed independently of the broader market regime. EasySwing reports five categorical states — Trending Up, Trending Down, Ranging, High Volatility, and Transitioning — based on market-level inputs including SPY price structure, breadth, McClellan momentum, and VIX. They are not points on a linear Strong Bull-to-Strong Bear scale, and Transitioning does not specify a direction.
- Trending Up: A bearish top is fighting a supportive market backdrop, while a confirmed inverse bottom is aligned with it.
- Trending Down: A confirmed top is aligned with the market backdrop, while a bullish inverse bottom needs stronger independent confirmation.
- Ranging: Both variants appear more often and mean less. A three-peak or three-trough structure inside a sideways range is frequently just range-bound chop, not a genuine reversal.
- High Volatility: Wider daily ranges can make neckline breaks noisier and increase practical execution risk.
- Transitioning: Signals are mixed or inputs are incomplete; the label is deliberately direction-neutral, so the chart must establish its own confirmation.
A head-and-shoulders top that completes while the broader market is still firmly Trending Up is a lower-conviction signal than the same pattern completing alongside deteriorating relative strength rank and a broader regime rollover.
How EasySwing Relates to Head-and-Shoulders Setups
EasySwing does not run a standalone head-and-shoulders shape classifier. The pattern therefore requires a trader's own visual assessment and neckline confirmation; a scanner result should not be described as detecting or confirming this shape.
Stock-level RS rank and ADX can provide separate context for a chart under review, but they are not both inputs to the market-regime classifier. That classifier uses market-level data rather than recognizing a stock's three-peak geometry.
EasySwing's active Trend Pullback and VCP Breakout detectors use their own moving-average and contraction rules; neither classifies an inverse head-and-shoulders. A stock may independently qualify for one of those named setups after a breakout, but that is a separate signal. Run a scan at strategies to see which setups are currently live.
Practical Checklist
Before treating a three-peak or three-trough structure as a confirmed head-and-shoulders, verify these conditions:
- ✅The pattern forms after an established prior trend — a genuine uptrend for a top, a genuine downtrend or extended base for a bottom
- ✅The head clearly exceeds (or, for a bottom, clearly undercuts) both shoulders — a marginal difference is not a valid head
- ✅The right shoulder fails to exceed the head's extreme, showing fading momentum on the third push
- ✅A daily close confirms the neckline break — a wick-only touch is not confirmation
- ✅Volume expands on the breakout relative to the quiet right-shoulder pullback
- ✅The broader market regime supports the direction of the break
- ❌Do not call the pattern before the neckline actually closes broken — an unconfirmed shape is just three peaks
- ❌Do not ignore a down-sloping neckline on a top or an up-sloping neckline on a bottom — slope affects the measured target's starting point
- ❌Do not treat the two variants as interchangeable — Bulkowski reports different results for each, under separate comparison groups
- ❌Do not chase a breakout that has already traveled most of the measured-move distance before you can enter
Frequently Asked Questions
What is a head and shoulders pattern in stock trading?
A reversal pattern made of three price peaks — a left shoulder, a higher middle peak (the head), and a right shoulder that fails to reach the head's high — connected by a neckline drawn under the two pullback lows between them. A confirmed close below the neckline signals the prior uptrend has reversed into a downtrend. Bulkowski's research on more than 2,800 tracked examples found a 19% break-even failure rate and an average decline of 16% after confirmation.
Is the head and shoulders pattern bullish or bearish?
The standard head-and-shoulders top is bearish — it signals a reversal from an uptrend into a downtrend. The inverse head-and-shoulders (or head-and-shoulders bottom) is the bullish mirror image, signaling a reversal from a downtrend into an uptrend. Bulkowski's data on 3,197 tracked bottoms shows the bullish inverse variant is actually the more reliable of the two, with an 11% break-even failure rate versus 19% for tops.
How do you calculate the price target for a head and shoulders pattern?
Measure the vertical distance from the head's extreme (the peak for a top, the trough for a bottom) to the neckline directly below or above it, then project that same distance from the breakout point in the breakout direction. This measured-move method is identical for both the top and bottom variants — only the historical odds of reaching that target differ, at 51% for tops and 71% for bottoms per Bulkowski's tracked data.
What is an inverse head and shoulders pattern?
The bullish mirror of the standard head-and-shoulders: three troughs where the middle trough (the head) sits lower than the two flanking troughs (the shoulders), connected by a resistance neckline above. A confirmed close above the neckline signals a reversal from a downtrend into a new uptrend. It is also called a head-and-shoulders bottom.
Does EasySwing screen for head and shoulders patterns?
No. EasySwing does not currently expose a standalone head-and-shoulders detector. Its market-regime label can provide broader context, and a stock may separately qualify for an active named setup, but neither result detects or confirms this three-point chart pattern.
EasySwing.trading provides market-regime context and scans for its own named setups; it does not detect head-and-shoulders geometry. For the base-pattern comparison, see Cup and Handle; for the full setup catalogue, see Swing Trading Strategies. Scan results are for informational purposes only. See our Risk Disclaimer.
Disclaimer: This article is for educational purposes only and does not constitute investment advice. EasySwing is a stock screening tool, not a registered investment advisor. All trading involves risk. Read our full disclaimer →