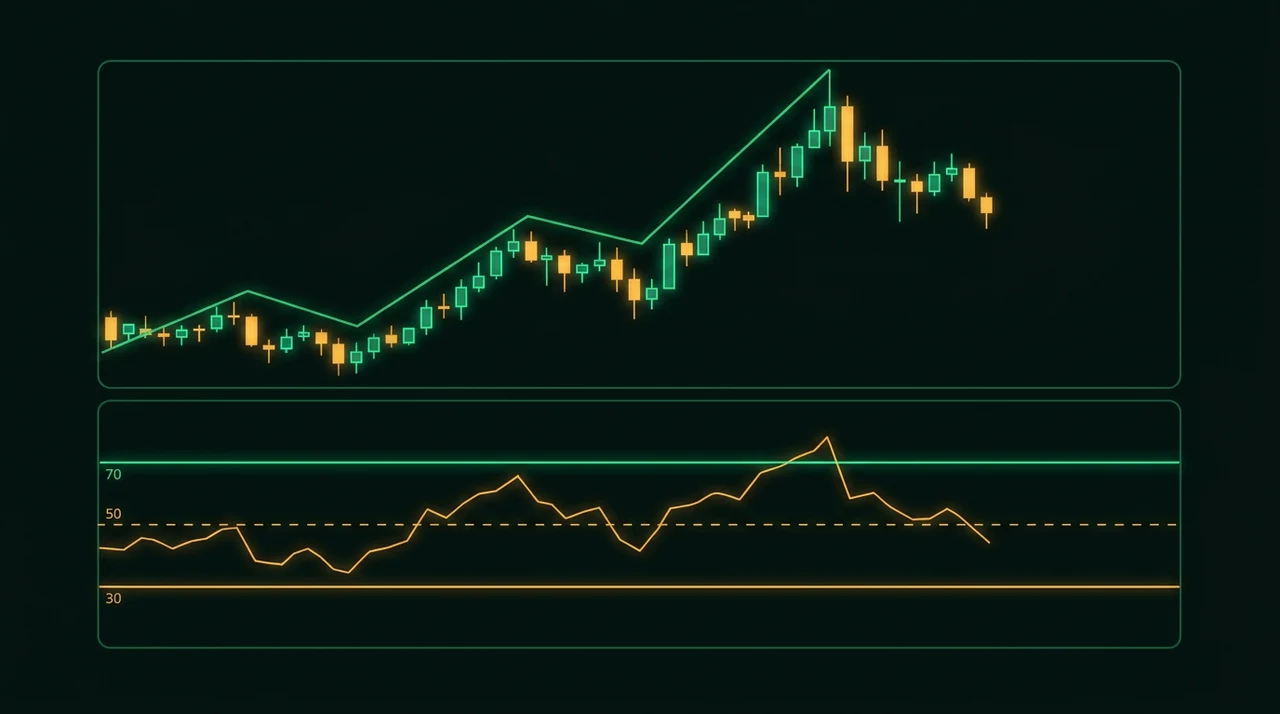
Stock Gaps Explained: Types, Fills and Swing Rules
Lou, Polk and Skouras (2019, Journal of Financial Economics) found that the bulk of momentum profits accrue overnight rather than during the trading day. A stock gap is a price jump between one session's close and the next session's open, with no trades in between. Swing traders hold through that jump, so they need to know which gaps carry information and which fade.
A gap forms when new information arrives while the market is closed, such as an earnings report, a guidance change or a sector headline. The open prints well above or below the prior range, leaving an empty zone on the daily chart. Five types matter: common, breakaway, runaway, exhaustion and island reversal.
Stock Gap Definition
A stock gap is an empty price zone on a daily chart where no shares changed hands. A gap up opens above the prior day's high. A gap down opens below the prior day's low. The size of the gap, the volume behind it and where it forms in the trend decide whether it matters.
Gaps are an overnight problem. Between the close and the next open, orders pile up on one side and the opening auction clears them at one price. If news is strong enough, the stock skips every price in between.
Edwards and Magee's Technical Analysis of Stock Trends (first published 1948) gave gaps a central place in classic charting, and Thomas Bulkowski's Encyclopedia of Chart Patterns devotes a chapter to measuring them. Both treat the gap as a clue about the trend's strength, not as a signal on its own.
On a daily chart, a gap is cleanly visible only on liquid stocks. Thin stocks gap constantly on tiny volume, and those gaps carry little information. A gap on 3× average volume says institutions acted. A gap on half of average volume says almost nobody cared.
The Five Types of Gaps
There are five types of gaps, and each one appears in a different stage of a trend. The label is only useful in hindsight, so traders use volume and location in the trend to make a probability call at the time. Here is how the types compare.
| Gap type | Where it forms | Volume | What it suggests |
|---|---|---|---|
| Common | Inside a range | Normal or low | Noise; usually fills fast |
| Breakaway | Out of a base or range | Very high | A new trend is starting |
| Runaway (continuation) | Mid-trend | Above average | Trend still has momentum |
| Exhaustion | Late in a long run | Very high, then stalls | Buyers are spent |
| Island reversal | After an exhaustion gap | High | Trend has reversed |
Common gaps appear inside trading ranges and on low-volume days. They usually close within days and rarely change the picture.
Breakaway gaps jump out of a base, consolidation or flat range on a surge of volume. They mark the point where supply and demand rebalanced at a new price. A gap out of a tight base is one of the strongest forms of price action a swing trader can see.
Runaway gaps show up in the middle of a strong trend. They signal that holders see no reason to sell and new buyers will pay up. In an uptrend, they often appear after a multi-week advance and a short pause.
Exhaustion gaps form near the end of a long advance. Volume is huge, the stock gaps up, and then it stalls or closes near the low of the day. That pattern means the last buyers just paid the highest price.
Island reversals are the extreme case: an exhaustion gap up, a few days of trading, then a gap down of similar size. The cluster of days sits isolated on the chart, which is how the pattern got its name.
How Gap Fills Work and When They Matter
A gap fill happens when price returns to the pre-gap close, covering the empty zone. Whether it is likely depends on the gap type, not on a rule that gaps always close. Common gaps fill often. Breakaway and runaway gaps can stay open for months in a strong trend.
The saying that every gap eventually fills is partly true over very long horizons and not useful for trading. A stock can fill a gap two years later after a 60% advance. Waiting for the fill as a trading plan means sitting in cash or taking a far larger loss than planned.
The practical reading is the reverse. A gap that fills within a few days after a high-volume breakaway tells you the move failed. The market tried a new price level and rejected it. That failure is a reason to exit, not a reason to add.
Test the claim on your own watchlist before relying on it. Pull the last 30 gaps of 5% or more on stocks you follow, split them by volume and trend location, and count how many filled within 10 days. The result is more useful than any general statistic, because it reflects the stocks and market you actually trade.
How Swing Traders Trade Gap Ups
The cleanest way to trade a gap up is to wait for the stock to show whether the gap holds, then enter on a pullback with a defined stop. Chasing the opening print gives the worst price and the widest stop. Patience after the gap usually gives a better risk-to-reward.
A five-step process works for most gap-up setups:
- Classify the gap. Check volume against the 50-day average and where the stock sits in its trend. A gap out of a base on 3× volume is very different from a gap in a 40%-extended stock.
- Wait one to three sessions. Watch whether the stock holds above the gap-day low and closes in the upper half of its range.
- Look for a quiet pullback. Volume should shrink as price drifts back toward the gap-day close or a rising moving average such as the EMA9/EMA20 zone.
- Set the stop below the gap-day low. If the gap fills, the thesis is wrong. A close below the gap-day low is the clear invalidation level.
- Size the position from the stop distance. Use position sizing with R-multiples so a stop-out costs a fixed fraction of the account.
Here is a calculator example with made-up numbers. A stock gaps from $40 to $44 and holds. The pullback entry is $44.50 with a stop at $42.80 below the gap-day low. Risk per share is $1.70. At 1% risk on a $20,000 account ($200), the sizer maps to about 117 shares.
Kristjan Kullamägi (Qullamaggie) and Pradeep Bonde (Stockbee) both built methods around gaps in stocks that were dormant before the news. Their episodic pivot idea is that a stock with a flat base and a sudden volume surge is being repriced, not just bouncing.
Gap Downs and the Risk of Holding Overnight
Gap risk is the chance that a stock opens beyond your stop level, so the loss exceeds the amount you planned to risk. A stop at $50 does not guarantee an exit near $50 if the stock opens at $44 after bad news. This is why overnight risk is part of position sizing, not an afterthought.
Two habits reduce the damage. First, size positions so that a gap through the stop is survivable. If a single-name gap of 10% would cost more than you can tolerate, the position is too large. Second, cap total open risk, a concept covered in portfolio heat.
Earnings dates are the most predictable source of gap risk. The earnings season guide covers how to decide whether to hold, reduce or exit before the report. Many swing traders simply close or shrink positions before earnings, because the gap is a coin flip they have no edge in.
Gap downs also offer information. A stock that gaps down on bad news and then reclaims the pre-gap close within a few days has shown strong demand. A stock that gaps down and stays below the gap-day high is showing supply. Treat these as reasons to reassess, not predictions.
Market direction matters too. A gap down in a single stock while the index is calm is a stock-specific event. A gap down across the board is a market event, and the market regime is the better guide for how aggressive to be.
How EasySwing Treats Gaps
EasySwing has one setup built around a gap: the Power Earnings Gap. It looks for a gap up of at least 8% from the prior close on volume at least 3× the 50-day average. The stock must also have been range-bound for the prior 60 days, close in the upper half of the day's range and hold above its 50-day SMA.
The setup's stop is the tighter of the gap-day low and a two-ATR stop, and a close below the gap-day low invalidates it. Every setup carries an entry, a stop and two targets (T1 and T2).
The Power Earnings Gap is a beta setup and has no published win rate. Historical test results are not a forecast. The full mechanics are in the Power Earnings Gap guide, and the broader record of what failed is in The Strategy Graveyard.
EasySwing does not detect candlestick patterns or classify gaps as breakaway or exhaustion automatically. The classification in this article is a manual step you apply to a chart.
Gap Trading Checklist
- ✅Check the gap against the 50-day average volume before judging it
- ✅Note whether the gap came out of a base or at the end of a long advance
- ✅Wait one to three sessions to see whether the gap holds
- ✅Place the stop below the gap-day low and size from that distance
- ✅Count how many gaps on your own watchlist filled within 10 days
- ❌Do not buy the opening print of a large gap up
- ❌Do not assume every gap has to fill before the trend continues
- ❌Do not hold full-size positions through an earnings date without a plan
- ❌Do not treat a gap on thin volume as a breakout
Frequently Asked Questions
What does gap up mean in stocks?
A gap up means a stock opens at a price above the previous session's high, leaving an empty zone on the chart. It usually follows news released while the market was closed. The size, volume and trend location decide whether it is meaningful.
Do all stock gaps get filled?
No. Common gaps inside a range often fill within days, but breakaway and runaway gaps can stay open for months in a strong trend. Treating a fill as certain is not a trading plan. Measure fill rates on your own watchlist instead.
What is the difference between a breakaway gap and an exhaustion gap?
A breakaway gap jumps out of a base on high volume and starts a new trend. An exhaustion gap forms near the end of a long advance, often with heavy volume followed by a stall. Location in the trend is the main clue.
Is it risky to hold a swing trade through a gap?
Yes. A stock can open beyond your stop level, so the loss can exceed the planned risk. Smaller position sizes, a cap on total open risk and a plan around earnings dates reduce the damage.
How do swing traders trade gap ups?
Most wait one to three sessions, confirm the gap holds, then enter on a quiet pullback with a stop below the gap-day low. They size the position from the stop distance rather than chasing the opening price.
EasySwing screens for Power Earnings Gap setups automatically. For the full gap-based setup, read the Power Earnings Gap guide, and for managing earnings-date gap risk see the earnings season guide. Volume context is covered in volume analysis for swing trading. Scan results are for informational purposes only. See our Risk Disclaimer.
Disclaimer: This article is for educational purposes only and does not constitute investment advice. EasySwing is a stock screening tool, not a registered investment advisor. All trading involves risk. Read our full disclaimer →