ROC Breakout: How Rate of Change Identifies Momentum Acceleration Before the Move
Jegadeesh & Titman (1993, Journal of Finance) documented that the top decile of 12-month return stocks outperformed the bottom decile by 12.01% annually — but the premium was strongest in the first weeks after momentum acceleration began, not after months of steady trending.
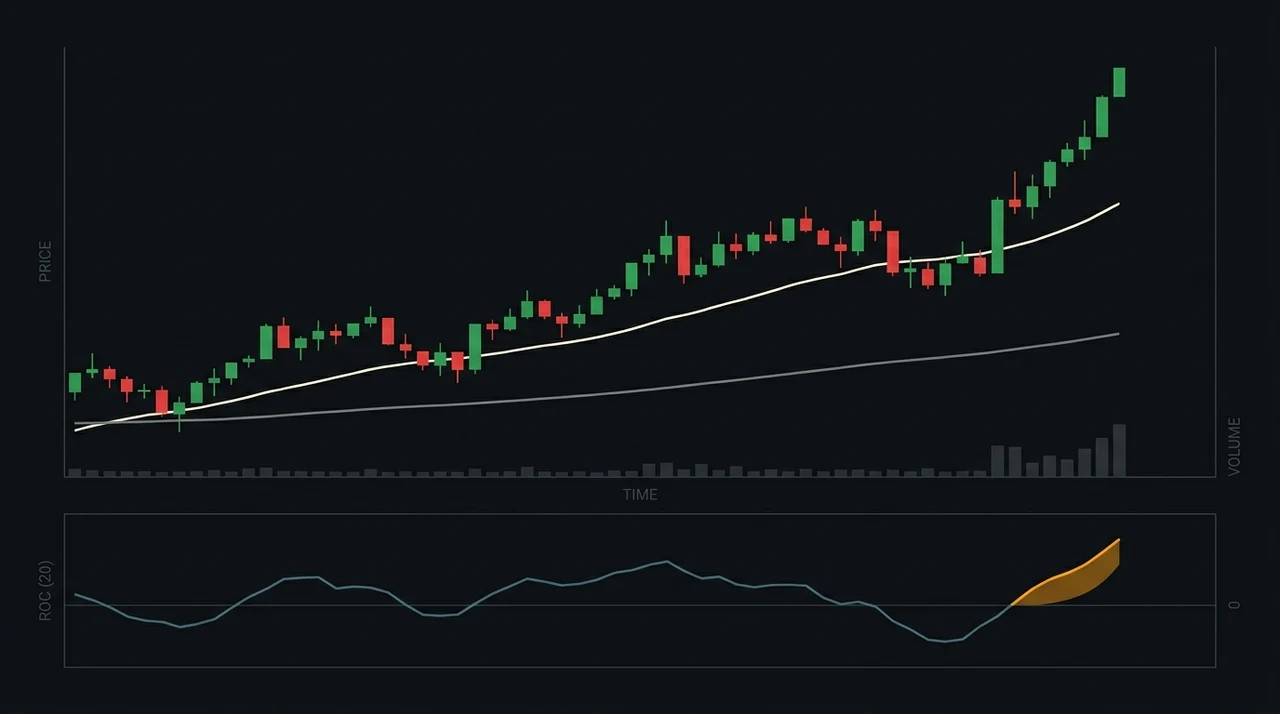
Rate of Change (ROC) captures that acceleration moment. Where standard momentum measures the full return, ROC measures how fast it arrived — making it an early quantitative signal that a new trend phase is strengthening. EasySwing's ROC Breakout strategy applies a 20-day Rate of Change filter — positive and rising — to catch the re-acceleration of institutional buying inside an established uptrend.
What Is the ROC Breakout Strategy
The ROC Breakout strategy identifies stocks whose 20-day Rate of Change is both positive (≥ 2%) and rising — accelerating, not merely trending — inside a confirmed Stage 2 uptrend with relative-strength leadership. EasySwing surfaces only Grade A+ setups; the tuned configuration returned a 2.02 profit factor across 2,625 holdout trades in Trending Up conditions.
Rate of Change is one of the oldest momentum indicators in technical analysis. In its simplest form, a 20-day ROC measures how much a stock has moved over roughly the past trading month: today's close minus the close 20 sessions ago, divided by that close, multiplied by 100. A reading of +3.8% means price gained 3.8% over the past month.
The signal is not the level alone — it is the level being positive and turning up. EasySwing requires the current 20-day ROC to sit above its reading from 10 sessions earlier. A stock that trends, pauses in low-ROC consolidation, then sees its ROC re-accelerate is showing institutional buyers re-entering after a quiet accumulation phase.
Most momentum research studies 6- to 12-month windows. The 20-day ROC targets something different: the re-ignition event within an existing trend. It catches an early measurable acceleration that can precede broader media coverage and retail momentum-chasing — the window between institutional conviction and public narrative.
The Academic Case for Momentum Acceleration
The momentum anomaly is among the most replicated findings in empirical finance. Jegadeesh & Titman's 1993 paper showed their zero-cost strategy — buying top-decile, shorting bottom-decile 12-month return stocks — earned 12.01% annually. Carhart (1997) confirmed momentum as a systematic risk factor in his four-factor model. Asness, Moskowitz & Pedersen (2013) extended it across 48 countries and four asset classes.
The short-horizon version of momentum — the first 1–4 weeks after acceleration begins — was separately documented by Lo & MacKinlay (1990), who identified positive weekly return autocorrelation: last week's winners tend to keep winning over the next one to four weeks. Their "short-horizon price continuation" captured a different phase of the momentum cycle than the Jegadeesh-Titman longer window.
Daniel, Hirshleifer & Subrahmanyam (1998) proposed that overconfidence among informed investors drives momentum at initiation. When institutional analysts develop conviction, they accumulate while retail attention is elsewhere — prices rise in the absence of widespread public information, creating the measurable acceleration that ROC picks up before the narrative reaches financial media.
As Jegadeesh & Titman wrote: "The returns on the portfolio formed based on past returns represent a genuine anomaly that cannot be explained by risk factors." ROC Breakout targets the moment that anomaly re-ignites.
The Five Entry Conditions EasySwing Checks
EasySwing scans a universe of liquid US equities at each market close, applying five hard gates in sequence and grading every qualifying setup with pre-calculated entry, stop, and target levels.
- 20-day ROC ≥ +2%. Price has gained at least 2% over the past 20 sessions. Below this floor, most readings reflect low-conviction drift or mean-reversion noise rather than directional institutional pressure.
- ROC is rising. The current 20-day ROC must sit above its reading from 10 sessions ago. This is the acceleration test that separates a re-igniting trend from one that is merely positive but fading.
- Stage 2 uptrend confirmed. The close is above the 50-day simple moving average, and the 50-day SMA is above the 200-day SMA. Stan Weinstein's (1988) stage framework ensures the ROC acceleration occurs within a structural uptrend — not a dead-cat bounce in a Stage 4 downtrend where the same ROC reading represents a failed rally.
- One-month return ≥ +2%. A confirmation that the acceleration shows up in absolute price progress over the past 21 sessions, not only in the smoothed ROC line.
- RS Rank leadership. Relative Strength Rank measures the stock's six-month performance versus the tracked universe. The detector requires RS Rank ≥ 40 as a floor and rewards stronger leadership in scoring — its A+ tier concentrates on names at RS Rank ≥ 90. Below the floor, ROC spikes tend to be sector-rotation plays or short-covering bounces rather than genuine leadership emergence.
Two gates sit above the five. EasySwing surfaces only Grade A+ ROC Breakout setups in the pick feed — the highest composite quality tier — and the market regime gate keeps the strategy active in TRENDING_UP only. In Trending Down, Ranging, or High Volatility regimes, EasySwing does not surface ROC Breakout picks.
EasySwing's ROC Breakout Backtest Results
EasySwing validated the ROC Breakout strategy using a walk-forward methodology: parameters were tuned on a training window (November 2022–March 2025), then performance was measured on a holdout window (May 2025–April 2026) the tuning procedure never touched.
Holdout period results (Trending Up):
| Metric | Holdout |
|---|---|
| Holdout period | May 2025 – Apr 2026 |
| Trades | 2,625 |
| Profit factor (net of fees) | 2.02 |
| Win rate | 42% |
| Average expectancy | +0.54R per trade |
| Robustness score | 0.92 |
| Permutation p-value | 0.000 |
EasySwing's ROC Breakout strategy produced a profit factor of 2.02 net of fees ($1.50/trade) and 5 bps slippage across 2,625 holdout trades. A 42% win rate with +0.54R expectancy is consistent with the momentum-continuation profile: fewer than half of trades are profitable, but the average winner substantially exceeds the average loser.
The 0.92 robustness score confirms the edge persists across 92% of tested parameter variations — clearing the 0.80 threshold EasySwing uses to credential a strategy as tuned. A score below 0.80 would suggest parameters curve-fit to a narrow window that would degrade on new data. Combined with a permutation p-value of 0.000 — in none of the 250 shuffle permutations did the random baseline match the observed holdout performance — the result indicates genuine signal rather than data-mining noise. The same parameters produced a 1.31 profit factor over 6,368 trades on the training window before validation.
Trade Structure: Entry, Stop, and Exit
EasySwing's ROC Breakout strategy uses a three-level trade structure calibrated to the strategy's tuned parameters.
Entry: A trigger placed just above the prior session's high (≈ 0.3% above), taken on a bullish close. Setups that meet every gate but close lower print as WATCH until a bullish close confirms the signal.
Stop: The tighter of two references — roughly 1.39× ATR14 below the entry, or just beneath the 50-day SMA (1% below it). The structural 50-day reference caps risk when the ATR stop would sit unreasonably far below price. Size the position so the stop loss equals ≤ 1% of total account equity — this bounds maximum loss per trade regardless of the stock's price level.
Targets (R is the per-share risk: entry minus stop):
- T1: 2.97R above entry. Scale out 50% of the position at T1 to lock in gains and reduce open risk.
- T2: 5.22R above entry. Trail the remaining 50% after T1 hits.
Maximum hold: 20 trading days. ROC breakouts that have not progressed within a trading month are treated as failed acceleration; the time stop releases capital back to fresh high-quality signals rather than letting stalled setups sit at break-even.
Regime management: ROC Breakout is credentialed and active only in Trending Up. A shift to Trending Down or High Volatility is a signal to tighten management on any open position and stop adding new ones — the institutional demand that sustains 20-day ROC acceleration degrades faster than a fresh position can be built out when macro conditions deteriorate.
How ROC Breakout Fits the Momentum Framework
EasySwing runs multiple momentum-oriented strategies across different entry triggers. Understanding where ROC Breakout sits avoids duplication when running the strategies together:
| Strategy | Holding | Primary Signal | Best Regime |
|---|---|---|---|
| Frog-in-the-Pan | ~19 days | Continuous 6-month return path | Trending Up |
| Qullamaggie Breakout | 20–40 days | Prior +30% leg + consolidation breakout | Trending Up |
| VCP Breakout | 14–28 days | Volatility contraction + pivot point | Trending Up |
| ROC Breakout | up to 20 days | 20-day ROC positive and rising | Trending Up |
| Trend Pullback | 10–20 days | Pullback to EMA9/EMA20 in uptrend | Trending Up / Ranging |
ROC Breakout keys off the earliest measurable acceleration — the rate of change turning up — rather than waiting for a fully formed chart pattern. Where VCP waits for multi-week volatility contraction and Qullamaggie requires a prior established momentum leg, ROC Breakout can flag a name 1–3 sessions before a recognizable pivot completes, while still allowing up to 20 trading days for the continuation to play out.
The same stock can trigger both a ROC Breakout signal and a Qullamaggie signal within the same week. The ROC signal often fires first (near the base highs as the consolidation ends); the Qullamaggie signal fires when the breakout clears the upper boundary. Traders who catch the ROC signal early carry a lower-cost basis into the continuation move.
ROC Breakout Setup Checklist
Use this checklist before entering any ROC Breakout setup:
- ✅20-day ROC ≥ +2% on the signal close
- ✅20-day ROC rising — above its reading from 10 sessions ago (acceleration confirmed)
- ✅Stage 2 structure — close above the 50-day SMA, and 50-day SMA above the 200-day SMA
- ✅One-month return ≥ +2%
- ✅RS Rank ≥ 40 leadership floor (A+ setups concentrate at RS Rank ≥ 90)
- ✅Grade A+ in EasySwing's walk-forward composite scoring — the only grade surfaced in the pick feed
- ✅Market regime TRENDING_UP
- ✅Stop at the tighter of ~1.39× ATR14 below entry or 1% below the 50-day SMA
- ✅Position sized so stop loss ≤ 1% of account equity
- ❌ROC reading driven mainly by a single earnings gap — event-driven spikes lack the institutional-accumulation context; the probability of follow-through drops materially
- ❌Stock is far extended above its 50-day SMA — mean-reversion risk rises sharply at elevated extension
- ❌Sector ETF in a Stage 4 downtrend — leadership in a declining sector rarely sustains the continuation move ROC predicts
- ❌Market regime Trending Down, Ranging, or High Volatility — EasySwing does not surface ROC Breakout picks outside Trending Up
Frequently Asked Questions
What is Rate of Change (ROC) in trading?
Rate of Change measures the percentage price difference between today's close and the close N periods ago — (today's close minus the close from N sessions ago) divided by that close, multiplied by 100. A positive ROC means price is higher than N days ago; a rising ROC means the rate of gain is accelerating. EasySwing's ROC Breakout strategy uses a 20-day ROC and requires it to be both positive (≥ 2%) and rising, distinct from the 6–12 month windows studied in classic momentum research.
Why does EasySwing use a 20-day ROC lookback?
The 20-day window — roughly one trading month — targets the re-acceleration of momentum within an existing trend, not the confirmation of a long-established one. Longer windows (63–252 days) overlap with the classic Jegadeesh-Titman momentum factor, which EasySwing addresses through the Frog-in-the-Pan and Qullamaggie strategies. The 20-day ROC is paired with an acceleration test — the current reading must exceed its level from 10 sessions earlier — to flag institutional re-entry after a low-ROC consolidation phase.
What does Grade A+ mean for a ROC Breakout signal?
Grade A+ is EasySwing's highest composite quality tier: the tightest combination of strong ROC (≥ 10%), super-leadership relative strength (RS Rank ≥ 90), strong one-month momentum, confirmed acceleration, and a bullish close. ROC Breakout surfaces only Grade A+ setups in the pick feed, each with pre-calculated entry, stop, and target levels — the holdout profit factor of 2.02 was measured on this credentialed subset. Lower grades are excluded.
How does ROC Breakout compare to the Qullamaggie Breakout strategy?
The Qullamaggie Breakout requires a prior 30%+ momentum leg followed by a 20-bar base consolidation and a volume-confirmed breakout above the consolidation high. The ROC Breakout has no prior-leg requirement and no minimum consolidation depth — it fires whenever the 20-day ROC is positive and rising with Stage 2 structure and RS leadership intact. ROC Breakout often fires earlier in the cycle; both target a continuation move and both require a TRENDING_UP regime for entries.
Can I set an alert for ROC Breakout signals in EasySwing?
Yes. EasySwing's Alerts panel lets you subscribe to ROC Breakout signals by strategy name, with optional grade filters. When a qualifying stock's 20-day ROC turns up through the threshold with the required grade, you receive a notification with the pre-calculated entry, stop, and target levels. Visit /strategies to configure your alert preferences.
EasySwing.trading automatically scans a universe of liquid US equities each trading session for ROC Breakout setups, evaluating the five hard gates at market close and assigning A+/A/B+/B/C grade scores with pre-calculated entry, stop, and target levels. For more on EasySwing's momentum strategy lineup, see Frog-in-the-Pan Momentum and Momentum Trading: How to Find Breakout Stocks. Scan results are for informational purposes only. See our Risk Disclaimer.
Disclaimer: This article is for educational purposes only and does not constitute investment advice. EasySwing is a stock screening tool, not a registered investment advisor. All trading involves risk. Read our full disclaimer →