How to Trade EMA Crossovers in Swing Trading
Park and Irwin's 2007 review in the Journal of Economic Surveys covered 95 modern studies of technical trading rules and found that 56 reported profitable results. An EMA crossover is a trend-confirmation signal, not an entry signal: it tells you the trend has already turned, and the profit comes from how you trade what follows.
An EMA crossover happens when a faster exponential moving average, such as the 9-day, crosses a slower one, such as the 20-day or 50-day. Swing traders get the best results when they trade the crossover only inside an established uptrend, wait for a pullback, and use a defined stop. This guide covers how the signal works, the three pairs worth tracking, a five-step entry process, and when to skip the signal entirely.
How an EMA Crossover Works
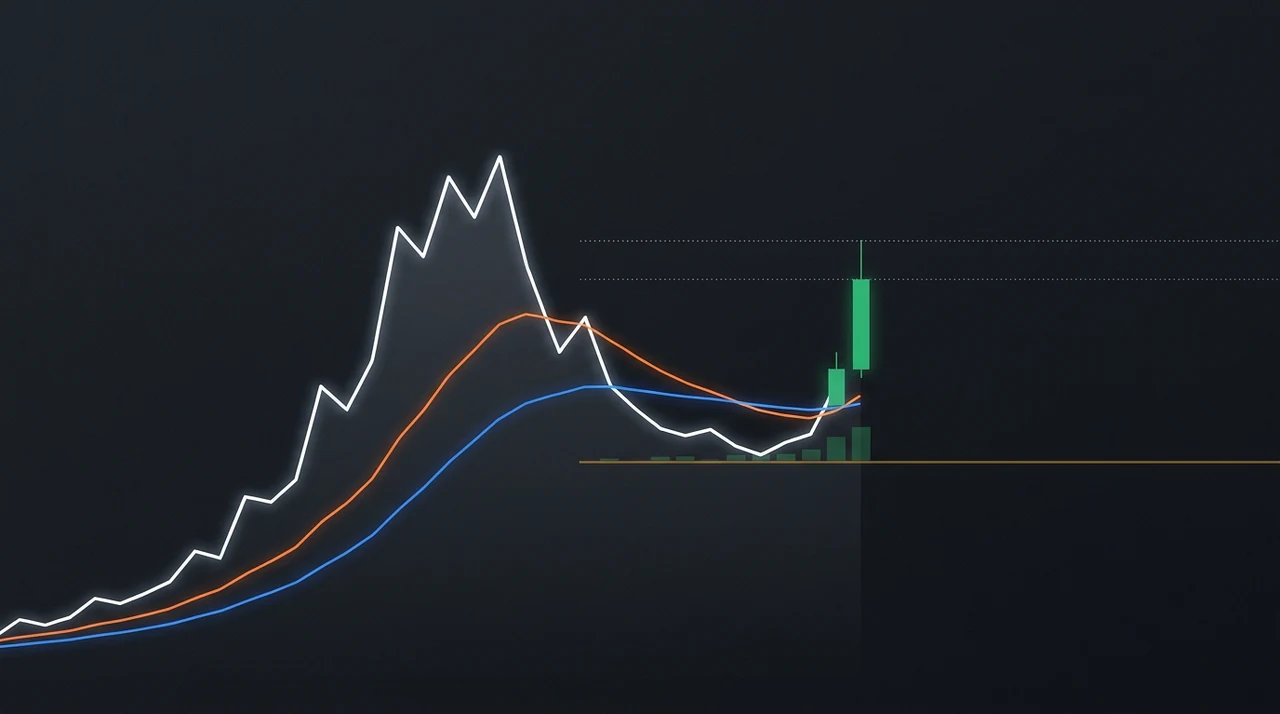
An EMA crossover signals a possible trend change when a short-period exponential moving average crosses above or below a longer-period one. The EMA weights recent closes more heavily than older ones, so the fast line reacts first and the slow line follows. When the fast line moves above the slow line, recent prices are running ahead of the longer average.
The weighting is what separates an EMA from a simple moving average. A 9-day EMA applies a multiplier of 2 / (9 + 1) = 0.20 to the newest close, so a single day carries 20% of the line's value. A 20-day EMA applies about 0.095, and a 50-day EMA about 0.039.
That responsiveness comes with a cost. A moving average of N days lags price by roughly (N - 1) / 2 days, which puts the 9-day EMA about four days behind and the 50-day EMA about 24 days behind. A crossover therefore always confirms a move that has already started.
John Murphy makes the same point in Technical Analysis of the Financial Markets (1999): moving averages follow trends rather than anticipate them. Treat the cross as evidence that the trend has changed, then look for a better price to join it.
The Three EMA Crossover Pairs Swing Traders Use
Swing traders track three pairs, each matched to a different holding period: the 9/20 EMA cross for short swings, the 20/50 cross for multi-week trends, and the 50/200 cross (the golden cross and death cross) for long-term stage changes. Faster pairs fire more often and fail more often.
| Pair | Typical Hold | Signal Frequency | Main Weakness |
|---|---|---|---|
| 9 / 20 EMA | 3-10 days | High (several per quarter) | Whipsaws in sideways markets |
| 20 / 50 EMA | 2-6 weeks | Moderate | Enters late in fast moves |
| 50 / 200 (golden cross) | Months | Low (often once a year or less) | Confirms after most of the move |
The 9/20 pair suits the 2-to-30-day horizon of most swing trades. It fires early enough to catch a new leg but gives a false signal whenever price chops around both lines.
The 20/50 pair filters more noise. It works well as a trend-health check: while the 20 EMA stays above the 50 EMA, the intermediate trend is intact.
The 50/200 pair is a stage indicator, not a timing tool. Our moving average guide explains why the long-term lines work best as a filter rather than a trigger.
Why Trading Every Crossover Loses Money
Trading every crossover loses money because most crossovers occur in sideways markets, where price oscillates around both averages and the lines cross repeatedly without a trend developing. Each cross generates a signal, and each signal in a range tends to reverse within days. The result is a string of small losses called whipsaws.
The failure pattern is predictable. A stock drifts sideways for six weeks, the 9 EMA crosses above the 20 EMA, price rolls over two days later, and the lines cross back. Do that four times and the account has lost four stops with no trend to pay for them.
The fix is a trend-strength filter before you act on any cross. Two simple versions work:
- ADX above 20 or 25. Wilder's Average Directional Index measures trend strength rather than direction. A cross with ADX below 20 is a range-bound cross. Our ADX guide covers the thresholds.
- A rising 50-day SMA with price above the 200-day SMA. This confirms the stock is in an advancing stage before the short-term cross counts. The Stage 2 analysis post explains the structure.
Both filters reject the same thing: crosses that happen without a trend behind them. Applying either one removes a large share of the false signals before you risk any capital.
A Five-Step Process for Trading an EMA Crossover
A practical EMA crossover trade has five steps: confirm the trend and market regime, wait for the cross, wait for a pullback to the fast EMA, enter on a bounce candle with a defined stop, and exit on a pre-set rule. Skipping the pullback is the most common mistake.
Step 1: Confirm the trend
Before the cross matters, the stock should close above its 50-day SMA and 200-day SMA, with the 50-day sloping up. Check the broad market too. A bullish cross in a stock fighting a falling index has a lower hit rate. The market regime post shows how to classify the backdrop.
Step 2: Wait for the cross
Watch for the 9 EMA to close above the 20 EMA, ideally with both lines sloping up. A cross where the slow line is still falling is a counter-trend bounce, not a trend change.
Step 3: Wait for the first pullback
Do not buy the cross candle. After the cross, price usually extends away from the averages and then pulls back toward the 9 and 20 EMA zone. Buying that pullback puts your stop close to price and improves the reward-to-risk ratio compared with chasing the cross.
Volume should contract on the pullback. Heavy-volume selling into the EMAs suggests distribution rather than a routine dip.
Step 4: Enter on a bounce with a defined stop
Wait for a candle that closes back above the 9 EMA after touching or nearly touching the 20 EMA. Place the stop below the pullback low or 1.5 ATR from entry, whichever is tighter and still outside normal noise. Our stop loss guide compares both methods.
Step 5: Exit on a rule, not a feeling
Use one of three exits: a close below the 20 EMA, a fixed target at 2R to 3R, or a trailing stop under the 9 EMA once price extends. A cross back below (9 under 20) is a reasonable final exit, though by that point a good share of the profit has usually gone.
Example: Sizing a 9/20 EMA Crossover Trade
Take a stock at $48.00 after a bounce off the 20 EMA at $46.80, with a pullback low of $46.20 and a 14-day ATR of $1.40. A stop at $46.00 sits just under the pullback low and about 1.4 ATR from entry, so the risk is $2.00 per share.
At a 1% account risk on a $50,000 account, the risk budget is $500. The position-size math gives $500 / $2.00 = 250 shares, a $12,000 position. A 2R target sits at $52.00 and a 3R target at $54.00.
This is arithmetic from the inputs, not a recommendation. Change the stop distance and the share count changes with it. The position sizing guide covers R-multiples in detail.
EMA Crossover vs MACD vs Pullback Entries
An EMA crossover, MACD, and a trend pullback all measure the same thing, the gap between fast and slow price averages, but they differ in timing. MACD is built from the difference between the 12-day and 26-day EMAs, so a MACD zero-line cross is effectively a 12/26 EMA crossover with a visual histogram.
| Method | What It Measures | Timing |
|---|---|---|
| EMA cross (9/20) | Fast vs slow average | After the turn |
| MACD signal cross | Change in the fast/slow gap | Slightly earlier than the cross |
| Pullback to the EMA zone | Price relative to rising averages | After the cross, at a lower-risk price |
Our MACD guide covers the histogram in more detail. The practical conclusion is that adding MACD to a crossover rarely adds new information, because both come from the same two averages.
The pullback entry in the last row is the version that tends to work. The pullback to a rising MA post shows why waiting for price to return to the averages beats buying the cross itself.
How EasySwing Uses the EMA Stack
EasySwing does not trade or alert on the cross itself. Its Trend Pullback setup, based on Kunal Desai's Bone Zone approach, looks for stocks where the EMA9 sits above the EMA20 and the EMA20 above the SMA50, then flags price pulling back into the EMA9/EMA20 zone on declining volume with a bounce candle for confirmation.
That is the crossover logic after the fact. The cross has already happened, the stack is aligned, and the screener waits for the lower-risk pullback entry. The setup is also gated by market regime and relative strength, and it surfaces in Trending Up and Ranging conditions only.
Because the EMA stack is checked daily across the full universe, you do not need to watch hundreds of charts for fresh crosses. The screener returns only relative-strength leaders that have the alignment and are sitting in the entry zone now.
EMA Crossover Checklist
Run this list before acting on any crossover signal:
- ✅ Price closes above a rising 50-day SMA and above the 200-day SMA
- ✅ ADX is above 20, or the slow EMA is clearly sloping up
- ✅ The broad market is not in a confirmed downtrend
- ✅ You wait for the first pullback to the 9/20 EMA zone instead of buying the cross candle
- ✅ Volume contracts on the pullback
- ✅ The stop is defined before entry and the position size comes from that stop
- ❌ Do not trade crosses that occur inside a sideways range
- ❌ Do not buy a cross where the slow EMA is still falling
- ❌ Do not use a 50/200 cross as a short-term timing signal
- ❌ Do not widen the stop after entry because the trade is moving against you
Frequently Asked Questions
What is the best EMA crossover for swing trading?
The 9/20 EMA cross fits most swing holds of 3 to 10 days, and the 20/50 cross suits multi-week trends. Neither works well alone. Pair the cross with a trend filter such as a rising 50-day SMA or ADX above 20, and wait for the pullback entry.
Is an EMA crossover a buy signal?
An EMA crossover confirms that a trend has changed, but it is not a good standalone buy signal because it lags price by several days. Most of the favorable risk-to-reward comes from buying the first pullback after the cross rather than the cross candle.
Do EMA crossovers work in a sideways market?
Not reliably. In a range, price oscillates around both averages, which produces repeated crosses and a run of small stop-outs. Check ADX or the slope of the 50-day SMA first, and skip crosses when the market lacks a trend.
What is the difference between an EMA crossover and a golden cross?
A golden cross is a specific crossover: the 50-day average crossing above the 200-day. It marks a long-term stage change and often arrives months after the low. A 9/20 EMA cross is a short-term signal that fires far more often.
Should I use EMA or SMA for crossovers?
An EMA reacts faster because it weights recent prices more heavily, which suits shorter swing holds. An SMA is smoother and produces fewer false crosses, which suits long-term stage filters. Many swing traders use EMAs for the 9 and 20 and SMAs for the 50, 150, and 200.
EasySwing screens for EMA stack alignment and trend pullbacks automatically. For related reading, see Moving Averages for Swing Trading, Pullback to a Rising MA, and MACD for Swing Trading. Scan results are for informational purposes only. See our Risk Disclaimer.
Disclaimer: This article is for educational purposes only and does not constitute investment advice. EasySwing is a stock screening tool, not a registered investment advisor. All trading involves risk. Read our full disclaimer →