ADX Indicator: How Swing Traders Use Trend Strength to Filter Setups
J. Welles Wilder introduced the Average Directional Index in New Concepts in Technical Trading Systems (1978) to answer one question: is this market actually trending? His threshold — ADX above 25 separates trending markets from ranging ones — has remained the industry standard for nearly five decades. Most traders use RSI, MACD, and moving averages but skip ADX entirely. That gap costs them on every entry into a choppy, directionless market.
Most of the thirteen named setups in our swing trading strategies guide require a confirmed trend to deliver repeatable edge. ADX is the filter that tells you whether a trend exists before you commit capital to a setup.
What the ADX Indicator Actually Measures
ADX (Average Directional Index) measures trend strength — not direction. A reading of 35 signals a strong trend, but gives no information about whether that trend is up or down. Wilder derived it from two directional movement lines, +DI and -DI, computed over a 14-period lookback. The ADX line itself is non-directional, ranging from 0 to 100. Confusing ADX with a bullish/bearish signal is the single most common misread of the indicator.
Wilder described ADX as a strength reading, not a directional reading. The underlying math captures the daily expansion of price ranges. When today's high exceeds yesterday's high (positive directional movement) or today's low undercuts yesterday's low (negative directional movement), those expansions are captured, smoothed over 14 periods, and divided to produce a dimensionless index reflecting the relative strength of directional bias over the lookback window.
All three lines together — ADX, +DI, -DI — form Wilder's Directional Movement System, introduced in the same 1978 book that also presented the RSI and Average True Range. ADX is a smoothed average of the underlying Directional Movement Index (DX). A high ADX value means the trend is strong; a low value means price is moving laterally or without consistent directional bias.
How to Read ADX Readings: The Four-Level Framework
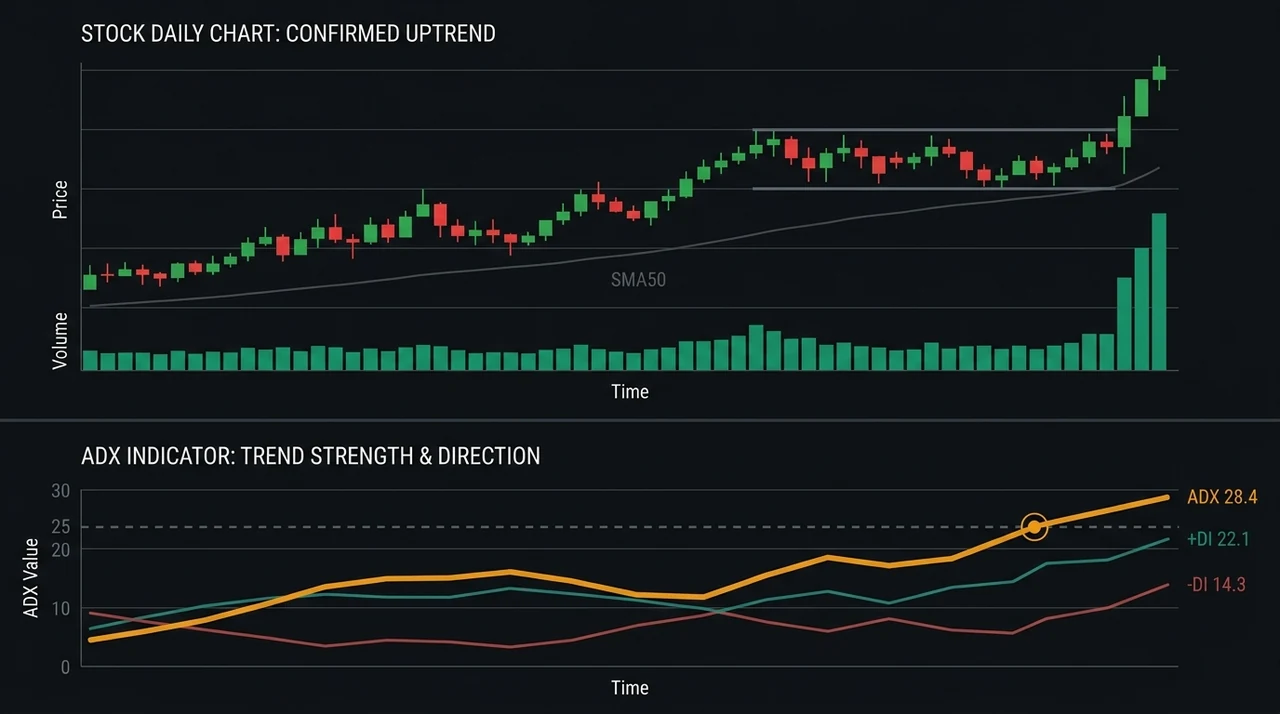
Wilder's original threshold system provides four interpretive levels. ADX below 20 signals a range-bound or directionless market where trend-following setups lose statistical edge. Between 25 and 40 is the primary trading zone: trends are established and worth following. Above 40 indicates a very strong trend, often entering its later phase — a condition that raises exhaustion risk on new entries.
| ADX Reading | Market Condition | Swing Trader Action |
|---|---|---|
| 0–20 | Weak / ranging market | Avoid momentum and breakout entries |
| 20–25 | Trend developing | Watch for setup; wait for confirmation |
| 25–40 | Strong trend — primary zone | Enter trend-following setups with full conviction |
| 40–60 | Very strong trend | Trade with tighter stops; watch for exhaustion |
| 60+ | Extreme — unusual | High caution; reversal risk elevated |
The practical implication: the best swing entries occur while ADX is rising through the 25–35 range — the early confirmation phase of an established move, before it draws in late-stage buyers. An ADX already above 45 at entry time often means the trend is mature and risk/reward has compressed. Entering while ADX is rising, not after it has peaked, is where the statistical edge is concentrated.
The Three-Line System: ADX, +DI, and -DI
The full Directional Movement System uses all three lines to answer two questions: is a trend present (ADX > 25), and which direction holds momentum (+DI vs. -DI)? Swing traders use the +DI/-DI relationship to confirm they are positioned on the right side of the trade before applying a price-action entry trigger. ADX alone cannot tell you whether to go long or short.
+DI (Positive Directional Indicator): Tracks upward price movement. When +DI is above -DI, buyers are driving daily directional expansion — the market is spending more energy moving up than moving down.
-DI (Negative Directional Indicator): Tracks downward price movement. When -DI is above +DI, sellers hold the directional edge. The spread between +DI and -DI reflects how decisively one side is in control.
Wilder's original crossover signal: buy when +DI crosses above -DI with ADX above 25; short when -DI crosses above +DI under the same condition. For swing trading, that crossover is too lagging as a direct entry signal. The more practical application: use the +DI/-DI relationship to confirm which side of the market aligns with the setup, then use price action — the breakout candle, pullback close, or volume confirmation — as the precise entry trigger. ADX and DI provide context; price action provides timing.
Swing Trading Checklist: ADX Conditions Before Entry
Before taking any trend-following setup, confirm these ADX conditions:
- ✅ ADX is above 25 — a trend is present and strong enough to trade
- ✅ ADX is rising — trend strength is building, not fading
- ✅ +DI is above -DI — directional momentum favors buyers (long setups)
- ✅ ADX is below 45 — trend is not in late-stage exhaustion territory
- ✅ Stock is in Stage 2 MA alignment — price above EMA20, SMA50, SMA150, and SMA200, each sloping upward
- ❌ ADX below 20 — range-bound conditions; skip momentum and breakout entries
- ❌ ADX declining from a peak above 40 — trend strength is fading; avoid new entries and tighten existing stops
- ❌ -DI above +DI on a long setup — sellers hold directional momentum; wait for the balance to shift
How ADX Complements Three Core Swing Setups
ADX functions best as a prerequisite condition — a requirement that must be met before a setup qualifies, not as an entry trigger itself. Before a setup advances to execution, ADX should confirm that a trend is present and strengthening. Three common swing setups produce measurably better results when this filter is explicitly applied.
Bull Flag + ADX: A bull flag requires a prior uptrend (the pole) and a tight, controlled consolidation. Without an ADX filter, flags forming in stocks with ADX below 20 behave like sideways chop: the breakout moves flat, stops out, or reverses. ADX above 25 at flag formation is a basic prerequisite for flags that continue. See the bull flag pattern guide for the full entry checklist.
Pullback to Rising MA + ADX: The pullback to rising moving average assumes the EMA20 or SMA50 is acting as dynamic support in an active trend. In a ranging market with ADX below 20, those moving averages are arbitrary price lines with no meaningful structural support. ADX above 25 confirms the moving average is doing real work — buyers are defending it as a reference point, not just approaching it by chance.
MACD Re-acceleration + ADX: The MACD histogram re-acceleration signal — histogram declining, then turning back up while the MACD line remains above zero — generates significantly more false positives in ranging markets than in trending ones. Restricting MACD entries to conditions where ADX > 25 is one of the most direct cuts against whipsaw entries. The histogram signal that drives the setup is covered in the MACD guide; ADX is the market-context prerequisite.
Three Limitations Swing Traders Should Know About ADX
ADX is a lagging, trend-strength-only indicator with no directional, momentum, or predictive component. Knowing what it does not measure is as important as knowing what it does. Three specific limitations define where ADX fails and where another framework is required.
Limitation 1 — ADX lags the start of a trend. It is a 14-period smoothed average of directional movement. By the time ADX crosses 25, a trend has typically been underway for several sessions. ADX cannot predict when a trend will begin — only confirm that one is already present. Use a leading signal (a breakout candle, high-volume close above resistance, a pivot close) to initiate the entry; use ADX to confirm the market context supports the trade.
Limitation 2 — ADX does not distinguish uptrend from downtrend. An ADX reading of 38 is equally valid in a stock advancing 30% and one declining 30%. Always cross-reference the +DI/-DI relationship and the stock's position relative to its moving averages. ADX gives the strength reading; the stock chart and moving average alignment provide the direction. Without that cross-reference, ADX alone is an ambiguous signal.
Limitation 3 — Strong trend does not guarantee continuation. ADX above 25 increases the statistical probability of follow-through — it does not eliminate reversal risk. Sector rotations, earnings surprises, and macro events can reverse strong trends in a single session. A structured stop loss — ATR-based, placed below the entry structure — remains mandatory. The swing trading stop loss guide covers ATR placement for each major setup type.
Frequently Asked Questions
What ADX reading is ideal for swing trading entries?
The 25–35 range is where the best swing entries form. ADX in this zone signals a trend that is established but not yet exhausted — institutional buyers are still actively building positions and there is room for follow-through. Above 40, risk/reward compresses because the easy portion of the move has already occurred. Below 25, the trend lacks the directional consistency that makes continuation setups reliable.
Is ADX a leading or lagging indicator?
ADX is lagging. It is a smoothed average of directional movement over 14 periods, which means it confirms trends that have already begun. Use it to evaluate market context, not to time entries. A price action trigger — a breakout bar, a close above a consolidation high, a volume confirmation candle — is needed as the leading signal for entry timing. ADX answers "is the trend strong?" after the trigger answers "is this the entry bar?"
How do I use ADX alongside RSI?
Use ADX to confirm the trend exists, then use RSI to identify where the stock is within that trend. In a confirmed uptrend (ADX > 25, +DI dominant), a pullback that drops RSI to 40–50 signals a healthy correction within the trend — not a reversal. The RSI mean reversion setup uses this exact pairing: RSI below 30 in a Stage 2 uptrend, with ADX confirming trend strength, produces entries where the risk/reward typically exceeds 2:1.
Can ADX replace MACD for trend analysis?
ADX and MACD answer different questions and work best together. ADX tells you whether a trend is strong enough to trade. MACD tells you about momentum direction and potential acceleration or deceleration within that trend. ADX at 30 with rising +DI, combined with a MACD histogram turning back up, produces a more complete trade confirmation than either indicator alone. The MACD guide covers the histogram re-acceleration signal that pairs most effectively with an ADX trend filter.
What happens when ADX starts declining from a high reading?
A declining ADX from a peak above 40 means trend strength is fading — the supply/demand imbalance that drove the move is evening out. This does not mean the stock will immediately reverse; it means the explosive phase of the trend is likely over. For open positions, a declining ADX from a high reading is a signal to tighten trailing stops. For new entries, wait until ADX re-establishes above 25 on a fresh directional leg before applying trend-following setups again.
EasySwing.trading automatically screens for ADX-Trend Momentum conditions — combining directional strength, +DI balance, RS Rank, and Stage 2 structure on every U.S.-listed equity. Related technical guides: MACD for Swing Trading, Moving Averages for Swing Trading, and Momentum Trading: Finding Breakout Stocks. Scan results are for informational purposes only. See our Risk Disclaimer.
Disclaimer: This article is for educational purposes only and does not constitute investment advice. EasySwing is a stock screening tool, not a registered investment advisor. All trading involves risk. Read our full disclaimer →