CANSLIM Stock Screener: How to Apply O'Neil's 7-Criteria System
William O'Neil studied 600+ of the biggest US stock market winners across five decades and found they shared a common signature before their biggest runs. He called the pattern CANSLIM — seven criteria covering earnings growth, new catalysts, supply-and-demand dynamics, relative strength, institutional backing, and market direction. In How to Make Money in Stocks (4th ed., 2009), O'Neil documents that the greatest winners carried an average relative strength rating of 87 before their major advances began.
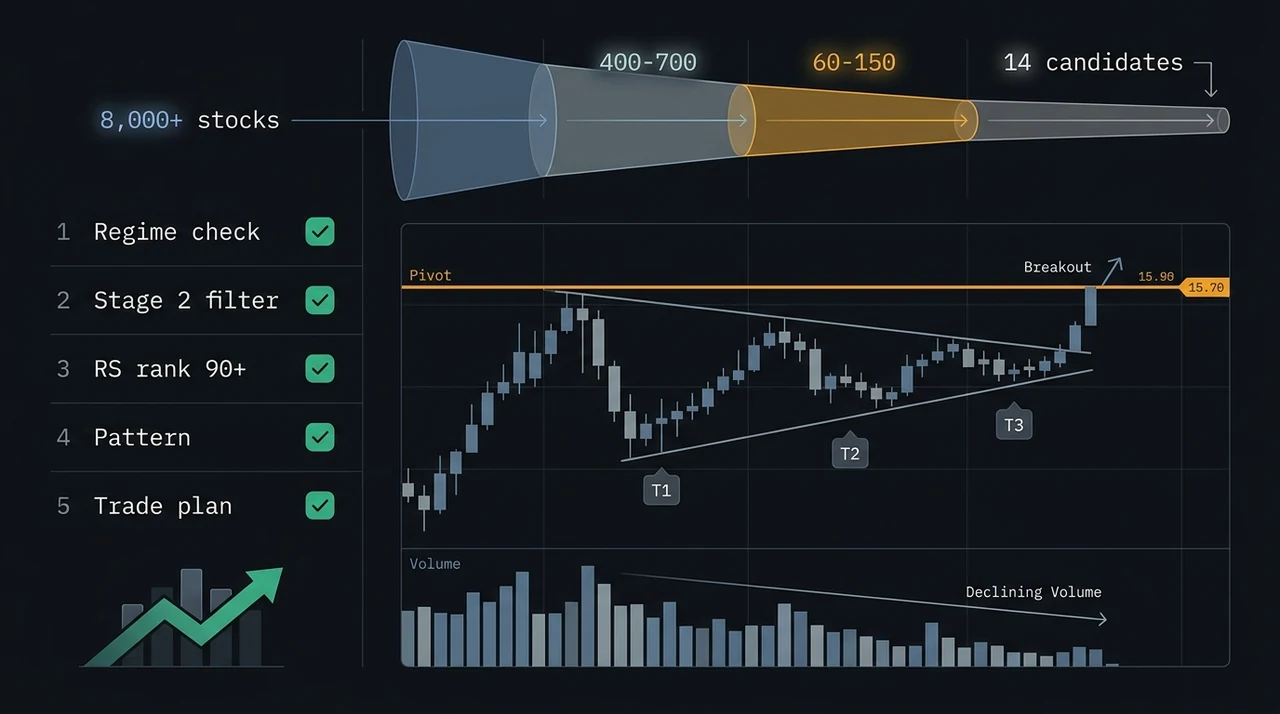
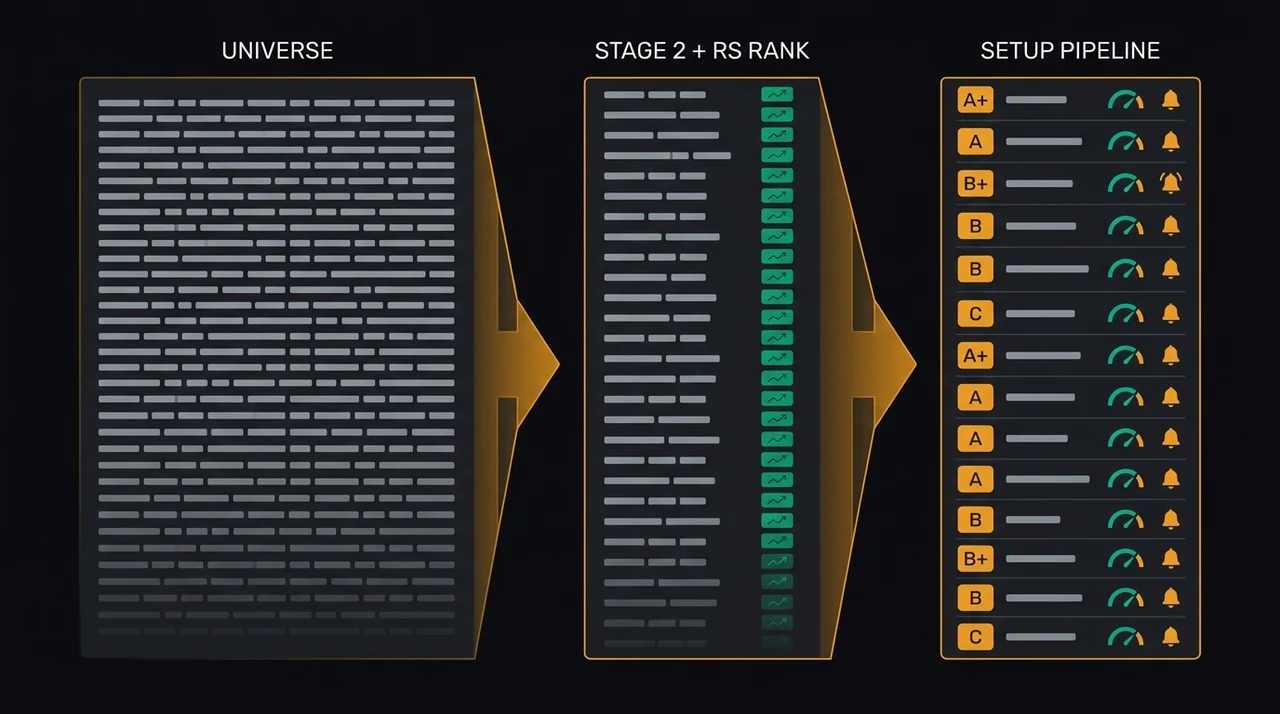
A CANSLIM screener applies those seven criteria as quantifiable filters to narrow thousands of stocks to the handful where all conditions align simultaneously. This guide covers each criterion, how to screen for it, and which four EasySwing automates through its technical engine every session.
The 7 CANSLIM Criteria
Each letter in CANSLIM maps to a distinct, testable condition. O'Neil designed the system so that all seven must be present — dropping even one lowers the probability of a sustained move.
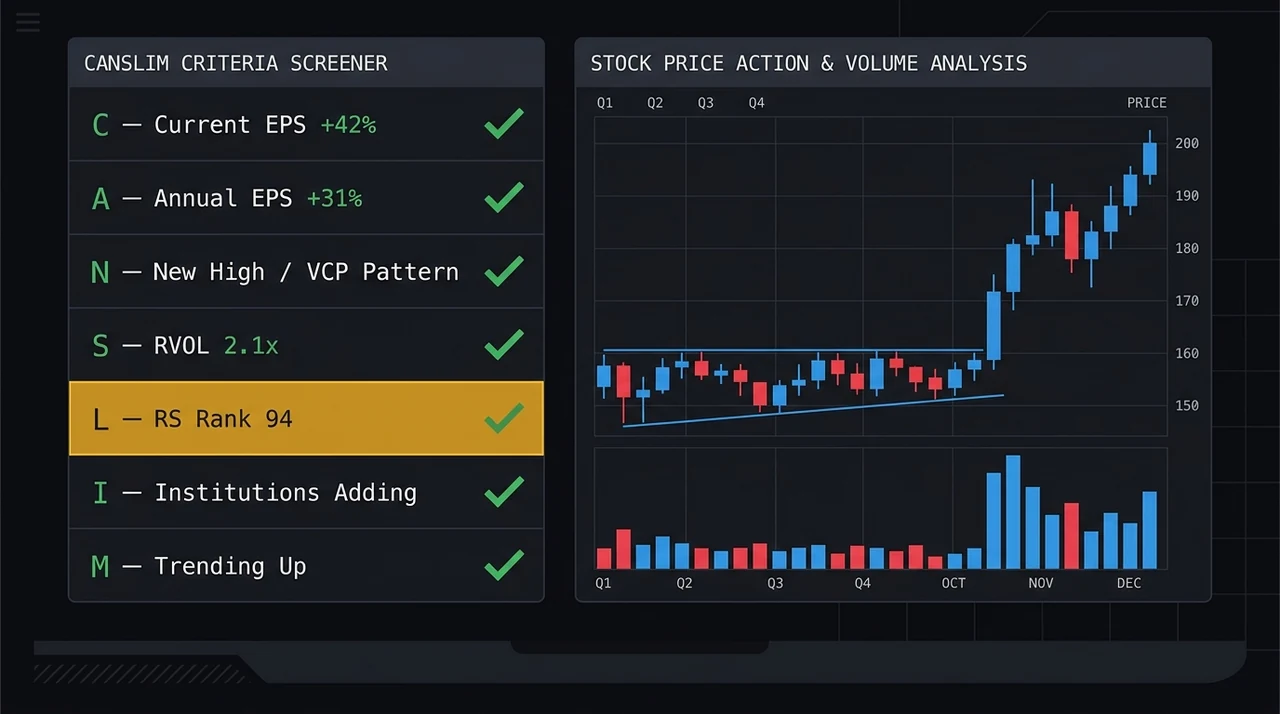
- C — Current quarterly earnings: EPS growth of at least 25% in the most recent quarter versus the same quarter the prior year, with acceleration vs the quarter before that. Mediocre earnings do not produce superperformance.
- A — Annual earnings per share: Average annual EPS growth of 25% or more over the last three years. One-year spikes without a sustained trend are insufficient.
- N — New: New products, new management, new high prices. Stocks making 52-week highs on expanding volume — not stocks near multi-year lows hoping to recover.
- S — Supply and demand: Smaller float stocks respond more sharply to institutional buying. Volume on up-days should exceed volume on down-days over any multi-week period. Breakout-day volume must be significantly above average.
- L — Leader or laggard: O'Neil's own IBD database published RS rankings from 1 to 99. His rule: only buy stocks with RS rank 80 or higher — outperforming at least 80% of all other equities over the prior 12 months.
- I — Institutional sponsorship: A growing number of quality funds holding the stock. Institutional buyers leave footprints in the volume, price structure, and weekly accumulation patterns.
- M — Market direction: O'Neil's research showed that three out of four stocks eventually follow the broad market. Trading against a confirmed downtrend dramatically reduces the probability of any individual setup holding.
How to Screen Each CANSLIM Criterion
Not every criterion translates directly into a screener filter. Earnings data require a fundamental data source; technical conditions can be automated.
C and A — Earnings growth
These two criteria require quarterly and annual EPS data. EasySwing's StockFinder includes a minimum EPS-growth filter for the most recent quarter, which approximates the C criterion directly in-app. The three-year annual record (A) still needs a dedicated fundamental source — IBD's database, O'Neil's own Investors.com, or your broker's screener flag stocks meeting the 25%-plus multi-year threshold with acceleration. Run that pre-filter first and layer it on top of EasySwing's technical output in a two-step workflow.
N — New highs and named patterns
"N" is where technical screening takes over. Buying at new highs runs against most retail traders' instincts — it feels like chasing. O'Neil's research inverted that: new 52-week highs on above-average volume are where the biggest winners begin, not where they end. Mark Minervini, a two-time U.S. Investing Championship winner who studied under O'Neil's framework, validated the same rule in Trade Like a Stock Market Wizard (2013): institutional accumulation drives Stage 2 stocks to new highs precisely because fund managers are adding to positions before the broader public notices.
EasySwing's Stage 2 structural filter (price above the 50-day MA, 50-day above the 150-day, 150-day above the 200-day, with the 200-day sloping upward) and its named breakout patterns — VCP, Cup & Handle, Qullamaggie Breakout, HHV Breakout, ROC Breakout — capture the "N" condition automatically. The pattern detection engine runs on 2,000-plus equities every session and returns only stocks where a confirmable breakout structure is forming or has triggered.
S — Supply, demand, and volume
Volume is the most direct proxy for institutional supply and demand. O'Neil's threshold: breakout-day volume at least 40 to 50 percent above the 50-day average — an RVOL of roughly 1.4 to 1.5x. EasySwing measures relative volume (RVOL) — current-session volume versus the stock's own 50-day baseline. Its breakout detectors require volume around 1.4x the baseline on the breakout candle, and volume confirmation feeds directly into the setup grade. For a stricter O'Neil-style cut, set a minimum RVOL filter of 1.5x in the StockFinder.
Float matters separately. Smaller float stocks — typically under 50 million shares — amplify price moves because there are fewer shares available to absorb institutional buying. EasySwing's screener universe deliberately excludes the mega-caps, concentrating on the capitalization range where float constraints are most favorable for momentum moves.
L — Leader, not laggard
Relative Strength Rank directly operationalises the "L" criterion. O'Neil's rule of 80 minimum is the standard; many of his own examples carried RS ranks above 90 before major breakouts. EasySwing calculates a 6-month RS rank for every stock in its universe and applies an RS floor as a hard gate for setup detection. Stocks below the RS threshold are excluded regardless of how strong their chart pattern looks.
I — Institutional sponsorship
Direct fund-ownership data requires 13F filings or a dedicated service such as IBD's Accumulation/Distribution rating or Fintel. EasySwing proxies institutional accumulation through the technical signatures it leaves behind: Stage 2 trend structure, the ratio of up-volume to down-volume across recent weeks, and the contraction-and-tightening pattern visible in VCP and Cup & Handle setups. Genuine institutional accumulation produces these structural signatures before the formal 13F disclosure arrives.
M — Market direction
EasySwing's market regime engine detects five states — Trending Up, Trending Down, Ranging, High Volatility, and Transitioning — using breadth indicators, VIX levels, and index trend data. This is the systematic equivalent of O'Neil's "M" criterion. A CANSLIM screener without a regime gate generates signals in every market environment. Three out of four stocks follow the broad market, which means an unfiltered screener is working against the majority of its own output during corrections.
EasySwing applies the regime gate at the strategy level: each strategy is only allowed in the regimes where its edge held up in testing, and in Transitioning conditions the quality floor tightens to B+ or better. A market regime in a downtrend or ranging state removes momentum setups from the feed entirely rather than letting them through at reduced quality.
Which Four CANSLIM Criteria EasySwing Automates
EasySwing fully automates the four technical criteria — relative strength, new-high pattern structure, volume expansion, and market direction — every session, with no filter maintenance required.
| Criterion | What It Measures | EasySwing Implementation |
|---|---|---|
| L — Leader | RS Rank ≥ 80 | 6-month RS rank gate on all strategies |
| N — New highs / pattern | Stage 2 + breakout structure | Named-setup detection: VCP, Cup & Handle, Qullamaggie, 10 others |
| S — Supply / demand | Volume expansion on breakout | Breakout volume ~1.4x the 50-day baseline feeds the grade; optional minimum RVOL filter |
| M — Market direction | Confirmed uptrend | 5-state regime engine; setups outside a strategy's allowed regimes are removed |
The criteria EasySwing does not fully automate:
- C/A (earnings) — the StockFinder's EPS-growth filter approximates the current-quarter C criterion in-app; the three-year annual record (A) needs a fundamental source such as IBD, Investors.com, or your broker's screener.
- I (institutional sponsorship) — partially proxied through Stage 2 structure and accumulation patterns, but direct fund-ownership data requires IBD's Accumulation/Distribution rating or 13F analysis via a dedicated service.
A Practical Two-Step CANSLIM Workflow
Running CANSLIM as a systematic process means separating the fundamental pre-filter from the technical entry signal.
Step 1 — Fundamental pre-filter
Pull stocks from IBD, NASDAQ Weekly Review, or any screen that flags EPS growth ≥ 25% in the most recent quarter with multi-year acceleration. This is your C/A-passing universe — typically 50 to 200 stocks depending on the earnings cycle.
Step 2 — Technical confirmation in EasySwing
Open EasySwing's StockFinder. Sort by RS rank and set a minimum strategy score of 40 — the grade B floor. The output is already Stage 2 filtered, volume-confirmed, and regime-gated. Cross-reference against your Step 1 fundamental list: stocks appearing in both satisfy all seven CANSLIM criteria simultaneously. These are the setups to build a trade plan around.
Step 3 — Grade and regime check
Review the setup grade. A+ and A grades reflect the highest confluence — RS rank well above threshold, volume confirmation present, pattern tightness in the top range, regime aligned. B+ and B grades indicate a valid structure with slightly reduced confluence — still tradeable with normal sizing. C grades are the lowest-quality bucket.
Step 4 — Plan the trade
EasySwing's setup card pre-calculates entry zone, stop level (ATR-based), and two R-multiple profit targets — the levels are strategy-specific (for example, 2R and 4R on a VCP Breakout). This eliminates the discretionary sizing step that causes most retail traders to over-risk some setups and under-commit to others.
CANSLIM Screener Checklist
Use before adding any position built from a CANSLIM workflow:
Fundamental (complete before opening EasySwing):
- ✅ EPS growth ≥ 25% in most recent quarter year-over-year
- ✅ Annual EPS growth ≥ 25% average over 3 years
- ✅ Revenue growth confirming earnings (not cost-cutting-driven)
- ❌ Single-quarter earnings spike without multi-year trend backing
Technical (EasySwing screens these automatically):
- ✅ RS Rank ≥ 80 (outperforming 80%+ of universe over 6 months)
- ✅ Stage 2 structure confirmed (all MA stack criteria met, 200-day MA slope positive)
- ✅ Named setup detected: VCP, Cup & Handle, Qullamaggie Breakout, or similar pattern
- ✅ Breakout volume expanding vs the 50-day baseline (~1.4x or higher)
- ✅ Market regime: Trending Up or Transitioning
- ❌ Grade C — insufficient confluence; pass on the setup
Position and trade management:
- ✅ Stop placed at EasySwing's ATR-based level (shown on setup card)
- ✅ Risk no more than 1% of total portfolio equity per trade
- ✅ Targets at the setup card's R-multiple levels (strategy-specific, e.g. 2R / 4R)
- ❌ Holding through a regime shift to Trending Down without re-evaluating
EasySwing screens the CANSLIM technical criteria automatically — RS rank gate, Stage 2 structure, named-pattern detection, RVOL confirmation, and market regime gating — across 2,000+ US equities each session. The multi-year earnings record and institutional-sponsorship criteria (A, I) require a fundamental data source layered on top. See related guides: relative strength rank, Stage 2 stock analysis, and the EasySwing vs IBD MarketSmith comparison. Scan results are for informational purposes only. See our Risk Disclaimer.
Frequently Asked Questions
Does EasySwing screen for all 7 CANSLIM criteria?
EasySwing automates four of the seven criteria: L (RS Rank ≥ 80), N (Stage 2 structure plus named-pattern detection), S (breakout volume expansion vs the 50-day baseline), and M (5-state market regime gate). For the C criterion, the StockFinder includes a quarterly EPS-growth filter; the three-year annual record (A) requires a dedicated fundamental source. Institutional sponsorship (I) is partially proxied through Stage 2 structure and accumulation patterns.
What RS rank does O'Neil recommend for CANSLIM stocks?
O'Neil's minimum is RS rank 80 — meaning the stock outperforms at least 80% of all equities over the prior 12 months. His own examples frequently showed ranks above 90 before major breakouts. EasySwing applies an RS floor to all strategy detection and displays the rank on every setup card so you can see exactly where each candidate sits relative to the full universe.
Can CANSLIM be used in a bear market?
O'Neil's "M" criterion requires the broad market to be in a confirmed uptrend. He found that three out of four stocks follow the general market direction, meaning most CANSLIM setups fail during corrections and bear phases. EasySwing's regime engine flags Trending Down and Ranging conditions and removes momentum setups from the feed — this is the systematic equivalent of O'Neil's market direction check.
Is EasySwing a replacement for IBD or MarketSmith?
No — the tools serve different parts of the CANSLIM workflow. IBD and MarketSmith provide earnings ratings, Accumulation/Distribution scores, and fundamental data that cover the C, A, and I criteria. EasySwing provides the technical side: Stage 2 screening, named-pattern detection, RVOL filtering, and regime gating. Used together, they cover all seven CANSLIM criteria. Used separately, each covers the half it was built for.
What is the difference between CANSLIM and the Minervini Trend Template?
The Trend Template is the structural prerequisite layer — eight moving-average and price-level criteria that identify stocks in confirmed Stage 2 uptrends. CANSLIM is the complete methodology, adding earnings, new-catalyst, and institutional-sponsorship criteria on top of that structure. In practice, every stock passing Minervini's Trend Template also satisfies the "N" and structural part of "L" in CANSLIM — but not automatically the earnings or sponsorship criteria.
Disclaimer: This article is for educational purposes only and does not constitute investment advice. EasySwing is a stock screening tool, not a registered investment advisor. All trading involves risk. Read our full disclaimer →