When to Sell a Swing Trade: Exit Rules That Protect Profits
The disposition effect — retail traders' tendency to sell winners too early and hold losers too long — costs investors an estimated 1–4% in risk-adjusted returns annually (Odean, 1998, Journal of Finance). Most of that underperformance isn't caused by poor entries. It comes from exits that have no plan.
The short answer: exit a swing trade when price reaches your pre-defined chart resistance target, when you have captured 2–3× your initial risk (2R–3R), or when the setup's thesis is invalidated by price action. Set all three exits before the order is placed. Adjust targets only when a written rule permits it.
Three Exit Types Every Systematic Swing Trader Needs
Systematic swing traders manage every trade with three distinct exit categories: profit targets set before entry, a stop-loss that defines maximum acceptable loss, and a time stop that closes slow-moving positions before capital is tied up indefinitely. Using all three prevents the most common exit error — holding a position without a defined end condition.
The three categories:
Profit target exits — price reaches your upside objective and you take the planned gain. Stop-loss exits — price invalidates the setup's structure and you exit at a pre-defined loss. Time-based exits — the setup fails to follow through within your expected window and you close at breakeven rather than wait for an unplanned stop.
Mark Minervini, two-time US Investing Champion, frames exit discipline precisely in Think and Trade Like a Champion (2017): the entry defines risk, but the exit determines whether you capture the plan or abandon it. A trader who enters well but exits without rules is running a defined-risk trade with an undefined reward process.
Setting Profit Targets Before You Enter
Before entering any swing trade, identify the nearest meaningful chart resistance — a prior swing high, a measured-move projection, or a minimum R-multiple target — and record it as your primary exit. Working backward from that level, calculate whether the trade is worth taking. If the first resistance is only 1.2R away from entry, the setup fails a basic quality filter regardless of how clean the pattern looks.
Three methods for locating profit targets:
Chart resistance: Prior swing highs are the most reliable targets for short-term positions. Price that reversed at a level once typically finds selling interest when it approaches from below. Mark the nearest visible swing high within 15–20% of entry — that's your primary target unless the stock is already in a clear Stage 2 trend with open air above.
Measured move: Pattern-based projections use the consolidation's depth as a distance. For a bull flag with a $3 depth, project $3 above the breakout pivot. This is especially reliable on VCP and bull flag setups where the base structure is geometrically clean.
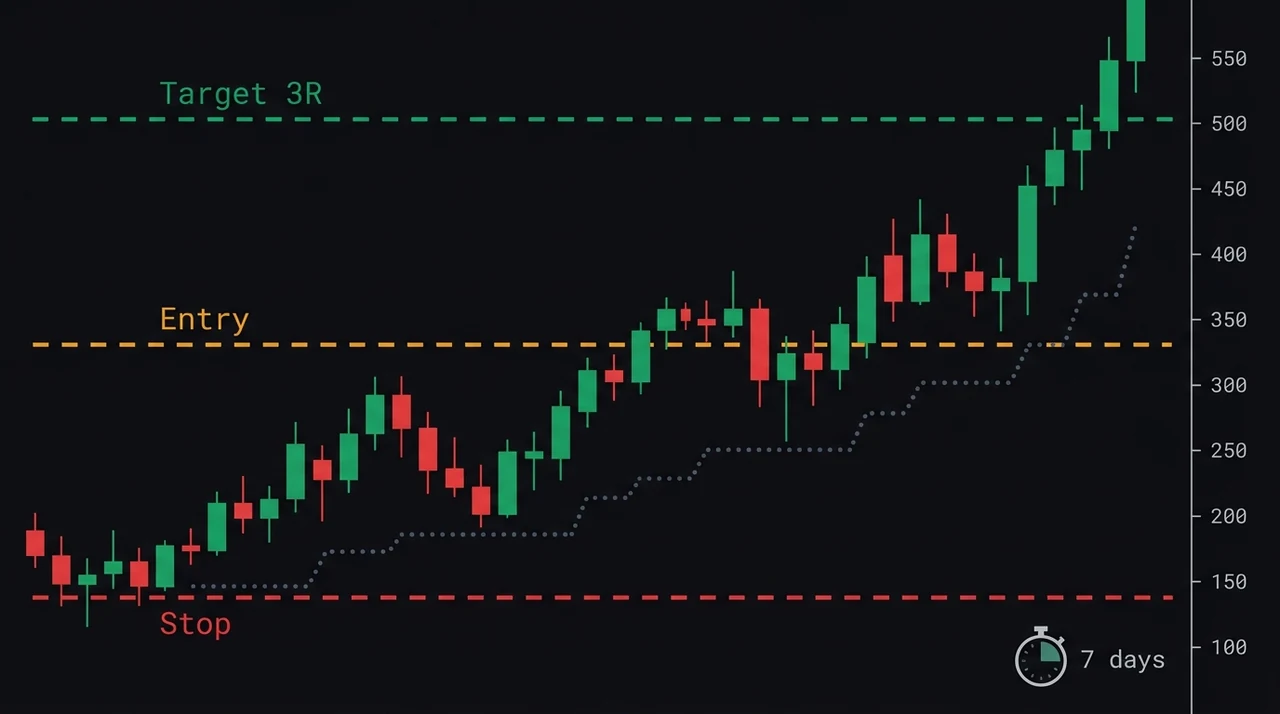
R-multiple targets: If your initial stop is $0.60 below entry (1R = $0.60 per share), a 2R target sits $1.20 above entry and a 3R target sits $1.80 above. Van Tharp (Trade Your Way to Financial Freedom, 2006) demonstrated that a system maintaining a minimum 2:1 reward-to-risk ratio remains profitable even with a 40% win rate. The R-multiple target isn't a preference — it's a minimum threshold for taking the trade at all.
Calculate the R-multiple before every entry. If the nearest resistance is less than 2R away, skip the trade and look for a better setup rather than adjusting your stop to force the math.
Stop-Loss Placement: Initial and Trail
Place your initial stop below the pattern's structural low — the level that, if broken on a daily close, invalidates the thesis behind the trade. The stop is not a pain tolerance percentage; it's the price where the reason for the trade no longer holds. Once the position has moved 1R in your favor, transition to a trailing stop that protects gains while allowing the position to extend.
Initial stop placement:
- Below the base low: For breakout setups, place the stop beneath the final contraction or handle low. A daily close below that level means sellers have re-established control and the breakout has failed.
- ATR-based cushion: Use 2× the 14-day ATR below entry for volatile stocks. This accounts for normal daily noise without stopping out a valid move on a routine fluctuation.
- Percentage override: Minervini's guidance in Trade Like a Stock Market Wizard (2013) caps the maximum loss at 7–10% below entry. Use this as an absolute ceiling when the structural stop requires a wider distance.
Trail stop methods after the trade reaches 1R gain:
| Method | Mechanics | Best Suited For |
|---|---|---|
| 3-ATR trail | Stops 3× ATR(14) behind the current daily close | Momentum stocks, volatile breakouts |
| 21-EMA trail | Exit on daily close below the 21-day EMA | Stage 2 uptrends, trending leaders |
| Prior swing low | Trail to each successive higher swing low | Clean charting setups, low-volatility names |
| 10–12% hard trail | Stops 10–12% below the highest close reached | Broad-market pullback trades |
A trail stop's purpose is not to call the top — it keeps you in the trend until price structure actually breaks. The 21-EMA trail, for example, survives normal 3–5% pullbacks and only exits when the trend line breaks. For stop-placement examples on real setup charts, see the stop-loss strategies guide.
Time Stops: When a Setup Fails to Follow Through
A time stop closes a position that has neither hit the profit target nor the stop-loss after a defined number of sessions. If a breakout setup was expected to move within seven trading days and it hasn't, the thesis has likely failed — buyers are not absorbing supply at the rate the setup indicated. Recycling capital into a higher-probability setup is preferable to indefinite holding.
The framework is straightforward:
- At entry, record the expected follow-through window ("This setup should move within 7 sessions").
- Track session count. If price sits between entry and stop on day 7 — no meaningful move in either direction — exit at the close.
- Log the result as a time stop in your journal and redeploy the capital.
Academic work on momentum supports this approach. Hou, Xue, and Zhang (Review of Financial Studies, 2020) found that short-term momentum factors generate their return premium primarily in the 5–15 trading days following the signal. Positions that fail to move within that window statistically underperform going forward — consistent with the setup's edge having decayed.
Time stops matter most when the market regime is neutral or choppy. In Ranging or Transitioning conditions, even high-quality breakout setups follow through at lower rates. A tight time stop prevents marginal positions from sitting on the books for weeks before eventually stopping out.
Volume and Price Action Signals to Exit Early
Certain price action signals justify taking partial or full profits before price formally reaches your target. These signals appear when buying pressure is exhausted — they don't wait for resistance.
Climactic buying signals that suggest an early exit:
- A wide-range up day on 3–5× average volume after an extended run, especially when the stock gaps above the prior session close (exhaustion gap signal)
- A high-volume reversal candle — shooting star, doji, or bearish engulfing — closing at a visible resistance level with volume notably above average
- Three consecutive high-volume up days without a single rest day, indicating supply absorbing all demand as momentum decelerates
Distribution at resistance:
When price closes in the lower 25% of the day's range on elevated volume after a sustained run, institutional holders are distributing into retail buying interest. The structure — high volume, wide range, weak close — tells you large sellers are active. Selling partial or full position into that session, even before the formal target, protects the majority of the realized gain.
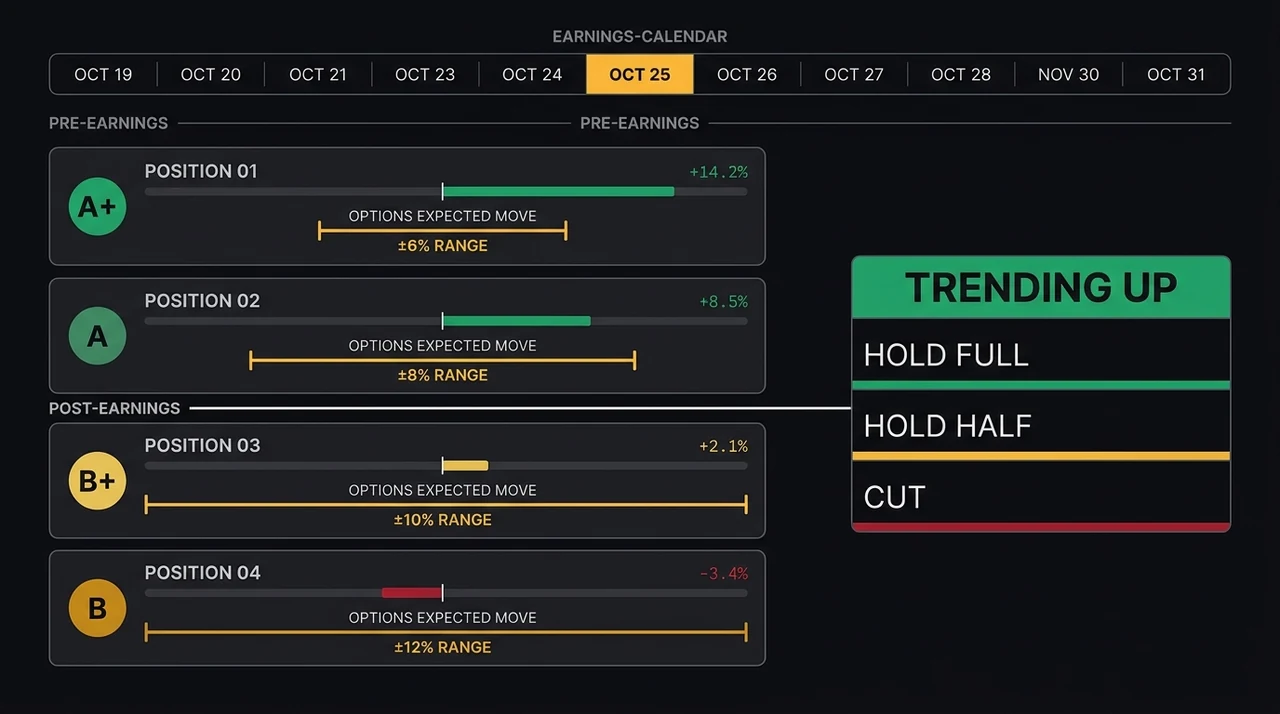
When these signals appear, consider exiting half the position and trailing the stop tightly on the remainder. If price re-stabilizes above key support without breaking down, the partial position can extend. If it breaks, the early exit preserved most of the trade's value.
Track Every Exit in Your Trading Journal
Exit quality compounds over time only when you have data to analyze. Most traders know their monthly win rate. Few track where their exits fall relative to where trades could have gone — the gap between realized gains and potential gains.
Key metrics to record for every exit:
- Exit price and reason: profit target, stop-loss, time stop, or early discretionary exit
- R-multiple realized: the final profit or loss expressed in R-units (e.g., +2.1R, −0.8R)
- MAE (Maximum Adverse Excursion): the furthest price moved against the position before resolution — tells you whether stops are too tight
- MFE (Maximum Favorable Excursion): the furthest price moved in your favor before resolution — tells you whether targets are too early or trails too loose
After 50+ trades, MFE data reveals systematic patterns. If your MFE consistently reaches 2–3R but your average realized gain is 1.2R, exits are too early — trailing stops are cutting winners before they extend. If MAE on losing trades frequently exceeds 1.5R before the stop triggers, stop placement is too wide for the volatility of names you're trading.
EasySwing's trade journal logs R-multiple, MAE, and MFE for every recorded trade. Review that data monthly; the patterns tell you more about where to adjust your exit rules than any general-purpose rule of thumb.
Exit Checklist for Swing Traders
Before placing any trade:
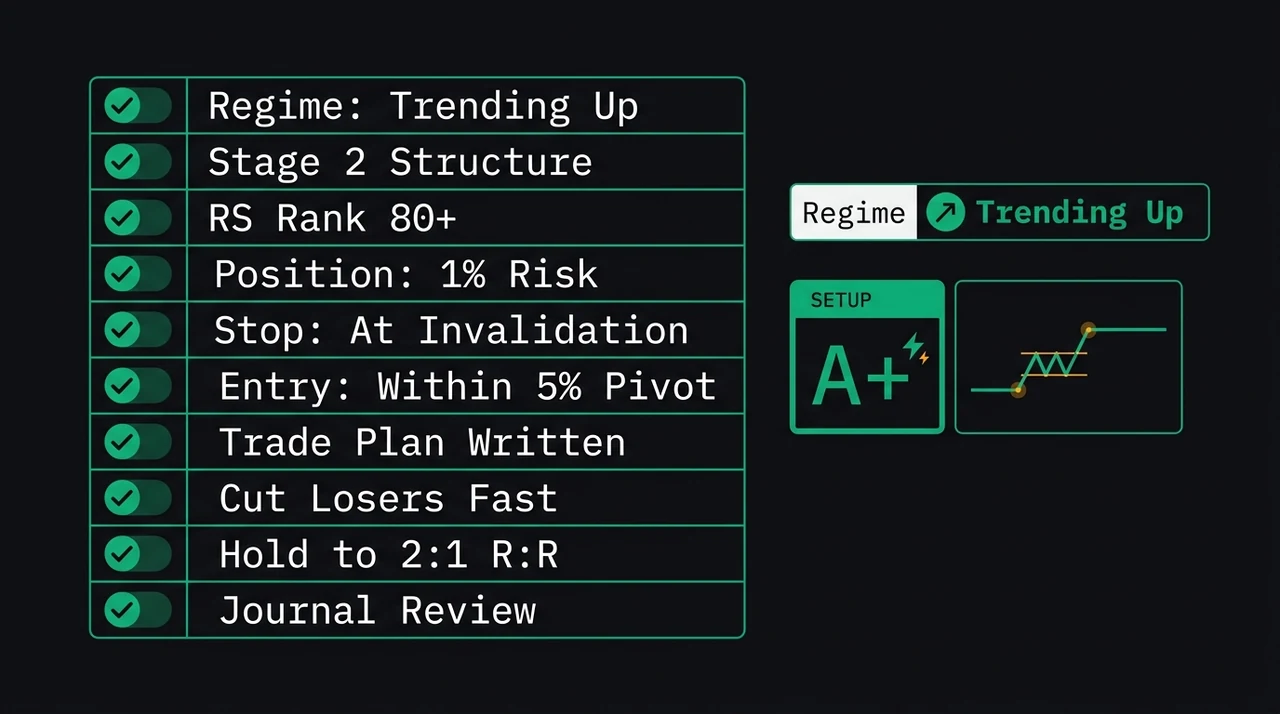
- ✅Profit target is pre-defined, based on chart resistance or an R-multiple calculation
- ✅Initial stop is placed below the structural pattern low — not a round percentage
- ✅R-multiple on offer is at least 2:1 (reward:risk) before entry
- ✅Time stop window is defined (e.g., 7 trading sessions to follow through)
- ✅Trail stop rules are written for if the trade reaches 1R gain
- ✅Exit plan is logged in the journal before the order is placed
Avoid:
- ❌Moving profit targets higher mid-trade without a pre-written rule permitting it
- ❌Holding past the time stop because the position "looks like it might move"
- ❌Letting a +2R winner return to breakeven by not trailing the stop
- ❌Setting the initial stop so tight it exits on normal intraday noise
- ❌Closing early on emotion during a routine pullback without a price-action signal
- ❌Ignoring high-volume reversal candles at resistance when price arrives near the target
EasySwing.trading automatically screens for named swing trading setups across 2,000+ US equities each session and logs every trade with R-multiple, MAE, and MFE analytics in the built-in trade journal — but it does not execute orders or provide personalized advice. Scan results are for informational purposes only. See our Risk Disclaimer.
Frequently Asked Questions
When should you take profits on a swing trade?
Take profits when price reaches your pre-defined chart resistance level or when you have captured 2–3× your initial risk (2R–3R). You can also exit early if high-volume reversal candles appear at resistance before the target — these signal exhausted buying pressure. Avoid moving targets higher mid-trade without a written rule permitting it; that turns a plan into hope.
How do you know when to cut a swing trade loss?
Exit when price closes below the setup's structural low — the pattern low or base low that defined your stop before entry. Mark Minervini recommends a hard maximum of 7–10% below entry as a ceiling. A losing trade held past its invalidation point typically compounds the loss rather than recovering, because the structural reason for the trade no longer holds.
What is a time stop in swing trading?
A time stop closes a position that hasn't moved meaningfully in either direction within a pre-defined window — typically 5–10 trading days. If the setup was expected to break out within a week and it hasn't, the thesis has likely failed and the capital is better deployed in a higher-probability setup. Time stops prevent capital from being tied up in stalled positions for weeks.
Should you use trailing stops on swing trades?
Yes — once a trade has moved at least 1R in your favor. Common methods include a 3-ATR trail behind the daily close, a 21-day EMA trail (exit on daily close below it), or trailing to each successive higher swing low. Trailing stops protect the majority of the gain while allowing momentum to extend, avoiding the common mistake of exiting a strong trend too early.
How does EasySwing help with exit tracking?
EasySwing's trade journal records every exit with R-multiple realized, MAE (max adverse excursion), and MFE (max favorable excursion) for each closed position. Over 50+ trades, MFE data shows whether targets are consistently too early, and MAE data reveals whether stops are too tight or too wide for your typical setup's volatility. That data drives calibrated exit rules instead of guesswork.
Disclaimer: This article is for educational purposes only and does not constitute investment advice. EasySwing is a stock screening tool, not a registered investment advisor. All trading involves risk. Read our full disclaimer →