Stochastic Oscillator for Swing Trading
Connors & Alvarez measured stochastic oversold readings across more than 7 million stock-days and found they resolved with a gain over the next five sessions 68% of the time in uptrending stocks — but less than 40% of the time in stocks trading below their 200-day moving average (Short-Term Trading Strategies That Work, 2008). The stochastic oscillator is not unreliable. It is context-dependent, and most traders use it without the context that makes it work.
The stochastic oscillator measures where price sits within its recent range. A reading below 20 means the close is near the low of the lookback period — oversold in the range. But "oversold in the range" in a Stage 2 uptrend signals a temporary pullback, not a reversal. The same reading in a Stage 4 downtrend signals a stock accelerating toward new lows.
What the Stochastic Oscillator Measures
The stochastic oscillator compares a stock's closing price to its price range over a lookback period — typically 14 sessions. A reading of 100 means the close hit the high of the range; a reading of 0 means it hit the low. Above 80 indicates the close is near the top of the range (overbought); below 20 indicates it is near the bottom (oversold). Two lines, %K and %D, generate the crossover entry signals.
George Lane developed the stochastic oscillator in the 1950s. His insight was straightforward: in rising markets, prices tend to close near the high of each session's range; in falling markets, they close near the low. The stochastic captures this tendency as a percentage and smooths it into a tradeable signal.
The two lines most traders monitor are:
- %K — the raw stochastic value. Fast and reactive to each session's close vs. range.
- %D — a 3-session simple moving average of %K. The signal line. Slower and smoother.
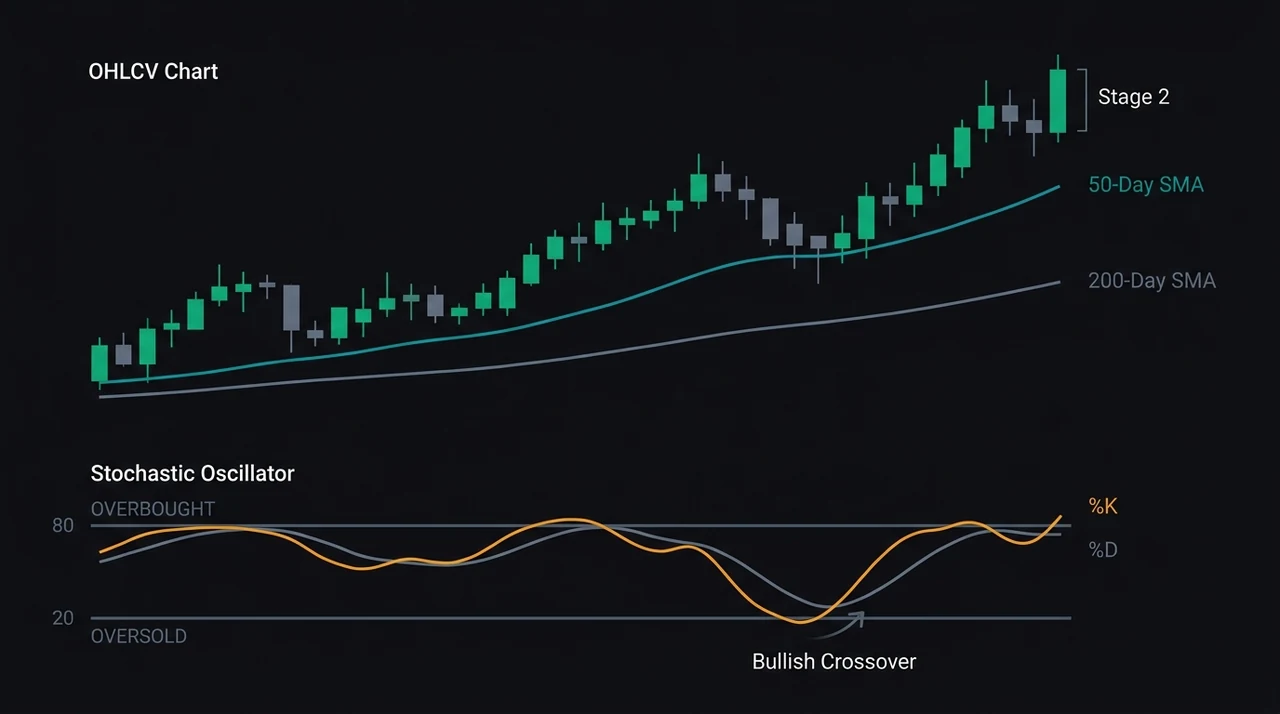
A bullish crossover occurs when %K crosses above %D from below the 20 threshold. A bearish crossover occurs when %K crosses below %D from above 80. Most charting platforms default to the "slow stochastic" — an additional smoothing pass on both lines that reduces noise at the cost of slightly later entries.
Lane himself was specific about context: "I never trade a stochastic signal without first knowing which direction the trend is going." That instruction contains almost everything a swing trader needs to know about using the indicator correctly.
How to Read %K and %D in Practice
Once %K drops below 20 and begins turning upward, watch for the crossover: %K crossing back above %D while both lines are still below 20 is the classic bullish signal. The converse — %K crossing below %D from above 80 — is the bearish signal. The crossover timing matters more than the absolute level.
Readings between 20 and 80 are neutral territory. A stochastic reading of 55 in the middle of the range carries no directional information on its own. The extremes are the only zones worth watching, and the signal is defined by direction change, not the level itself.
The most practical stochastic configuration for swing traders holding 3–10 sessions is the standard Slow Stochastic (14, 3, 3) — a 14-period lookback, 3-period smoothing on %K, and 3-period %D. Traders who want more sensitivity use (9, 3, 3). Those who want fewer signals and less whipsaw use (21, 7, 7). The lookback period should roughly match your holding period.
| Setting | %K Period | Smoothing | %D Period | Best For |
|---|---|---|---|---|
| Fast | 14 | 1 | 3 | Active, short holds |
| Slow (standard) | 14 | 3 | 3 | Swing trading (3–10 days) |
| Full | 21 | 7 | 7 | Wider swings (1–3 weeks) |
Watching %D alone — ignoring %K — misses the signal entirely. The crossover of %K through %D is the trigger; the position of both lines relative to the 20/80 thresholds is the context.
Two Stochastic Setups That Work for Swing Traders
The most reliable stochastic applications pair the oscillator with a confirmed trend structure. Using stochastic without trend context produces coin-flip results. With it, the two setups below have measurable edge.
Setup 1: Oversold Pullback in an Uptrend
The pullback entry is the stochastic's strongest swing trading application:
- Stock is in a Stage 2 uptrend — above its rising 50-day and 200-day MAs
- RS Rank above 80 — the stock is leading relative to the market
- Price pulls back to the 20-day EMA or 50-day SMA
- Stochastic %K drops below 20 during the pullback
- %K crosses back above %D — this is the entry trigger
- Stop placed below the pullback low or structural support
In this configuration, the stochastic oversold reading confirms the pullback has gone deep enough to reset the oscillator — the sellers who caused the pullback have largely exhausted themselves. The pullback-to-MA structure confirms the trend is intact. Entering when both conditions align produces entries with stop distances well-defined by the pullback low.
Setup 2: Overbought Fade in a Downtrend
When a stock is in a confirmed Stage 4 decline, stochastic above 80 during a reflexive rally sets up the short-side entry:
- Stock is below its declining 200-day MA (Stage 4 confirmed)
- Price rallies into the declining 50-day MA
- Stochastic climbs above 80
- %K crosses below %D from above 80
- Stop placed above the recent swing high
This fade setup works because institutional sellers use relief rallies to add short exposure at better prices. The stochastic overbought reading identifies those rallies and the rollover confirms the selling pressure has resumed.
Why Trend Direction Changes the Signal Completely
A stochastic reading below 20 in a Stage 2 uptrend signals a healthy pullback — institutions are getting a discount on a stock they want to own more of. The same reading in a Stage 4 downtrend signals a stock accelerating toward new lows as sellers overwhelm each attempt at stabilization.
The oscillator reads the same. The underlying market structure is completely different.
Jegadeesh & Titman (Journal of Finance, 1993) established that stocks showing strong momentum over 3–12 months continue to outperform — and that buying pullbacks in uptrending stocks captures a momentum premium that persists over time. The stochastic oversold pullback works because it aligns with this institutional momentum premium: you are buying a strong stock at a temporary discount, not buying weakness in a failing stock.
Market regime context amplifies this effect further. In a Trending Up market regime — where the S&P 500 breadth, trend, and volatility conditions all favor bulls — stochastic oversold readings in leading stocks resolve bullishly at much higher rates than they do in Ranging or Trending Down regimes. The oscillator signal captures the individual stock's positioning; regime context filters for the broader environment that determines whether that signal has follow-through.
Stochastic vs RSI: Which Oscillator to Use
Both indicators measure momentum and generate overbought/oversold signals, but from different angles. RSI measures the speed and magnitude of price changes using average gain vs. average loss. The stochastic measures where the closing price sits within the recent high-low range. In trending markets, RSI tends to be more stable. In range-bound or choppier conditions, the stochastic's range-comparison approach produces more responsive signals.
| Feature | Stochastic | RSI |
|---|---|---|
| What it measures | Close vs. recent range | Avg gain vs. avg loss |
| Sensitivity | Higher (faster signal) | Lower (more stable) |
| Default period | 14 | 14 |
| Overbought threshold | 80 | 70 |
| Oversold threshold | 20 | 30 |
| Lines | Two (%K and %D — crossover) | Single line |
| Best in | Range-bound, pullback entries | Trending markets, divergence |
When both stochastic and RSI agree — both below their respective oversold thresholds during a pullback in a Stage 2 uptrend — the confirmation is stronger than either indicator alone. Dual confirmation reduces the incidence of false bounces that turn into extended declines.
EasySwing's RSI Mean Reversion strategy uses a Connors-style RSI(5) below 30 as its primary signal, combined with a long-term uptrend filter (price above the 200-day MA) and regime context. The logic is equivalent to the stochastic oversold pullback setup, applied with a different oscillator. Traders who want additional confirmation before acting can require the stochastic also be in oversold territory before entering.
Stochastic Oscillator Checklist for Swing Traders
Before entering a trade based on a stochastic signal, confirm all conditions:
For a bullish stochastic pullback entry:
- ✅ Stock is in a Stage 2 uptrend — price above rising 50-day and 200-day MAs
- ✅ RS Rank above 80 — the stock is outperforming at least 80% of the market
- ✅ Stochastic %K has crossed below 20 during the pullback
- ✅ %K has crossed back above %D — the crossover confirmed
- ✅ Market regime is Trending Up or Ranging — not Trending Down or High Volatility
- ✅ A structural stop below the pullback low is defined before entry
Conditions that invalidate the signal:
- ❌ Stock is below its 200-day MA — oversold can become more oversold
- ❌ Stochastic has been stuck below 20 for 5+ sessions — persistence, not a bounce
- ❌ No stop loss defined before entry — the oscillator does not predict when the bounce begins
- ❌ Entering the overbought fade in a Stage 2 uptrend — in strong trends, stochastic can stay above 80 for weeks without reversing
EasySwing.trading screens for momentum and oversold pullback setups automatically across 2,000+ US equities each session. For the underlying oscillator logic behind EasySwing's named setups, see RSI Mean Reversion: How to Trade Oversold Bounces and Market Regime: How to Read Bull, Bear, and Choppy Markets. Related technical guides: ATR Indicator for Swing Trading and Fibonacci Retracement in Swing Trading. Scan results are for informational purposes only. See our Risk Disclaimer.
Frequently Asked Questions
What period setting works best for swing trading with the stochastic?
The Slow Stochastic (14, 3, 3) is the standard starting point for swing traders holding 3–10 sessions. It uses a 14-period lookback with 3-period smoothing on %K and a 3-period %D signal line. For more sensitivity use (9, 3, 3); for fewer signals and less whipsaw use (21, 7, 7). The lookback period should roughly match your typical holding period.
What is the difference between fast and slow stochastic?
Fast stochastic uses raw %K and a simple 3-period average as the %D signal line. Slow stochastic applies additional smoothing to %K before computing %D, making both lines less reactive to individual session noise. Most trading platforms default to slow stochastic. For swing trading on daily charts, the slow setting (14, 3, 3) is the standard choice.
Can the stochastic oscillator stay overbought for a long time?
Yes. In strongly trending Stage 2 stocks, stochastic can remain above 80 for weeks or even months without producing a meaningful reversal. Selling overbought readings in trending stocks is one of the most common stochastic misapplications. Overbought fades only work in confirmed downtrends or range-bound markets. In Stage 2 uptrends, use oversold pullback entries instead.
Should I use stochastic with other indicators?
Yes. Stochastic works best when combined with trend confirmation (Stage 2 MA stack), volume context (no panic spike on the bounce bar), and RS Rank (above 80 for long setups). A stochastic crossover from oversold in a confirmed uptrend with expanding relative volume is a much stronger signal than a bare crossover in isolation. The crossover is the trigger; the other filters are the context.
How is stochastic different from RSI for swing trading?
RSI measures momentum via the ratio of average gains to average losses over the period. Stochastic measures where the closing price falls within the recent high-low range. RSI is more stable in strongly trending stocks and better suited to trend-following entries. Stochastic responds faster to short-term range shifts and works well for pullback timing. Both can confirm each other when used together.
Disclaimer: This article is for educational purposes only and does not constitute investment advice. EasySwing is a stock screening tool, not a registered investment advisor. All trading involves risk. Read our full disclaimer →