Risk Reward Ratio for Swing Trading: How to Use It
At a 2:1 reward-to-risk ratio, a swing trader breaks even by winning 33.3% of trades, because the breakeven win rate is 1 divided by (1 + reward-to-risk). The risk reward ratio compares how much you stand to gain on a trade with how much you stand to lose if the stop is hit, and it only means something when paired with a win rate.
Most traders learn the ratio as a rule: "never take a trade below 2:1." That rule is half true. A 3:1 setup that wins 15% of the time loses money, while a 1:1 setup that wins 60% of the time makes it. This guide covers the formula, the win-rate trade-off, a worked trade with two targets, and the mistakes that make the ratio misleading.
What the Risk Reward Ratio Measures
The risk reward ratio is the distance from entry to target divided by the distance from entry to stop. If you risk $3 per share to make $6, the ratio is 2:1 (often written 1:2, risk first). The stop defines 1R, and every target is a multiple of it.
Van Tharp's Trade Your Way to Financial Freedom (1998) popularized measuring every trade in R-multiples, where 1R is the initial risk. A trade that makes twice its risk is +2R; a trade stopped out is -1R. Writing results in R makes trades with different prices and share counts directly comparable.
The formula uses three prices:
- Entry: the price where the trade begins
- Stop: the price where the trade is wrong; entry minus stop is the risk per share
- Target: the price where you plan to take profit; target minus entry is the reward per share
Reward-to-risk is reward divided by risk. A $50.00 entry with a $47.00 stop and a $56.00 target gives $3.00 of risk, $6.00 of reward, and a ratio of 2.0.
The ratio describes the plan, not the outcome. It says nothing about how likely the target is to be reached before the stop, which is why the next section matters more than the ratio itself.
Why Win Rate and Reward-to-Risk Cannot Be Judged Separately
A strategy is profitable when its win rate and reward-to-risk produce positive expectancy. The breakeven win rate equals 1 divided by (1 + R), where R is the reward-to-risk ratio. A higher ratio lowers the win rate you need; a lower ratio raises it.
Expectancy is the average result per trade, measured in R:
Expectancy = (win rate × average win in R) − (loss rate × average loss in R)
Van Tharp treated this number as the core measure of a trading system, since it combines how often you win with how much you make and lose. A positive expectancy means the strategy makes money across many trades. It says nothing about any single trade.
| Reward-to-risk | Breakeven win rate | Win rate for +0.25R per trade |
|---|---|---|
| 0.5:1 | 66.7% | 83.3% |
| 1:1 | 50.0% | 62.5% |
| 1.5:1 | 40.0% | 50.0% |
| 2:1 | 33.3% | 41.7% |
| 3:1 | 25.0% | 31.3% |
| 4:1 | 20.0% | 25.0% |
The right-hand column uses the same formula: win rate = (target expectancy + 1) / (1 + R). It shows that doubling the ratio does not halve the win rate you need, and that gains from a higher ratio flatten out. Moving from 1:1 to 2:1 cuts the breakeven win rate by 16.7 points. Moving from 3:1 to 4:1 cuts it by only 5.
These figures ignore commissions, slippage and gaps through the stop. Real costs shift every row of the table upward, so treat the breakeven column as a floor rather than a target.
How to Choose a Minimum Ratio for Swing Setups
Most swing traders set a minimum reward-to-risk of 2:1 or 3:1 before they consider a trade. The number matters less than the rule behind it: the minimum should reflect the win rate your setup produces, measured on your own trade history or a proper test.
William O'Neil's How to Make Money in Stocks advises cutting losses at 7% to 8% below the purchase price and taking profits near 20% to 25%. That implies roughly 3:1, and the rule works for O'Neil's breakout style because breakouts from tight bases are meant to produce a few large winners. Mark Minervini's Trade Like a Stock Market Wizard (2013) likewise caps losses at 7% to 8% and aims for winners that are a multiple of the loss. These ranges are reference guidance from books, not a limit EasySwing enforces.
Setup style changes the realistic ratio:
- Breakouts and continuation setups have lower win rates and larger winners, so a 2:1 to 3:1 minimum is common.
- Pullbacks into rising moving averages tend to win more often with smaller targets, and a 1.5:1 to 2:1 minimum can work if the win rate supports it.
- Mean-reversion bounces target a snap back to an average, so the ratio is often 1:1 to 1.5:1 and the strategy depends on a high win rate.
The pullback to a rising moving average and the VCP breakout illustrate the first two styles. A pullback's stop sits close to the entry, which raises the ratio without a larger target, but a tight stop also gets hit by normal noise more often.
Never pick a ratio first and then draw a stop and target to fit it. The stop belongs where the trade idea is invalid, and the target belongs at the next area where supply is likely. If the chart gives you 1.2:1 and your minimum is 2:1, the answer is to skip the trade, not to move the target.
A Worked Trade With Two Targets
A swing trade with a scale-out plan has a blended ratio that sits between its targets. Selling half at the first target and half at the second yields an average reward below the second target's R-multiple, and the stop-out result changes once the first half is sold.
Take a stock with an entry of $50.00 and a stop of $47.00, so 1R is $3.00. The chart shows resistance at $54.50 and a measured move to $59.00.
| Level | Price | Distance | R-multiple |
|---|---|---|---|
| Stop | $47.00 | -$3.00 | -1.0R |
| Target 1 | $54.50 | +$4.50 | +1.5R |
| Target 2 | $59.00 | +$9.00 | +3.0R |
Selling half the position at each target gives a blended result of (0.5 × 1.5R) + (0.5 × 3.0R) = +2.25R if both targets are reached. The plan reads as 2.25:1 even though the first target alone is only 1.5:1.
Three outcomes show why the plan has to be judged on all of them:
- Stopped out before Target 1: -1.0R
- Target 1 reached, then the stop moved to breakeven and hit: (0.5 × 1.5R) + (0.5 × 0R) = +0.75R
- Both targets reached: +2.25R
If the stock reaches Target 1 in 50% of trades and Target 2 in 20%, the expectancy is easy to compute. Out of 100 trades, 50 are stopped out first (-50R). Of the 50 that reach Target 1, 20 continue to Target 2 (+45R) and 30 stop at breakeven (+22.5R). The total is +17.5R across 100 trades, or +0.175R per trade. Those percentages are made up to show the arithmetic, not a measured result.
The same setup with no Target 1 and a single exit at $59.00 would need those 20 winners to carry the whole strategy: 20 × 3R - 80 × 1R = -20R. A scale-out plan changes the shape of the outcome, not just the ratio. The trailing stop guide covers how to manage the second half after Target 1 is hit.
How EasySwing Shows Reward Against Risk
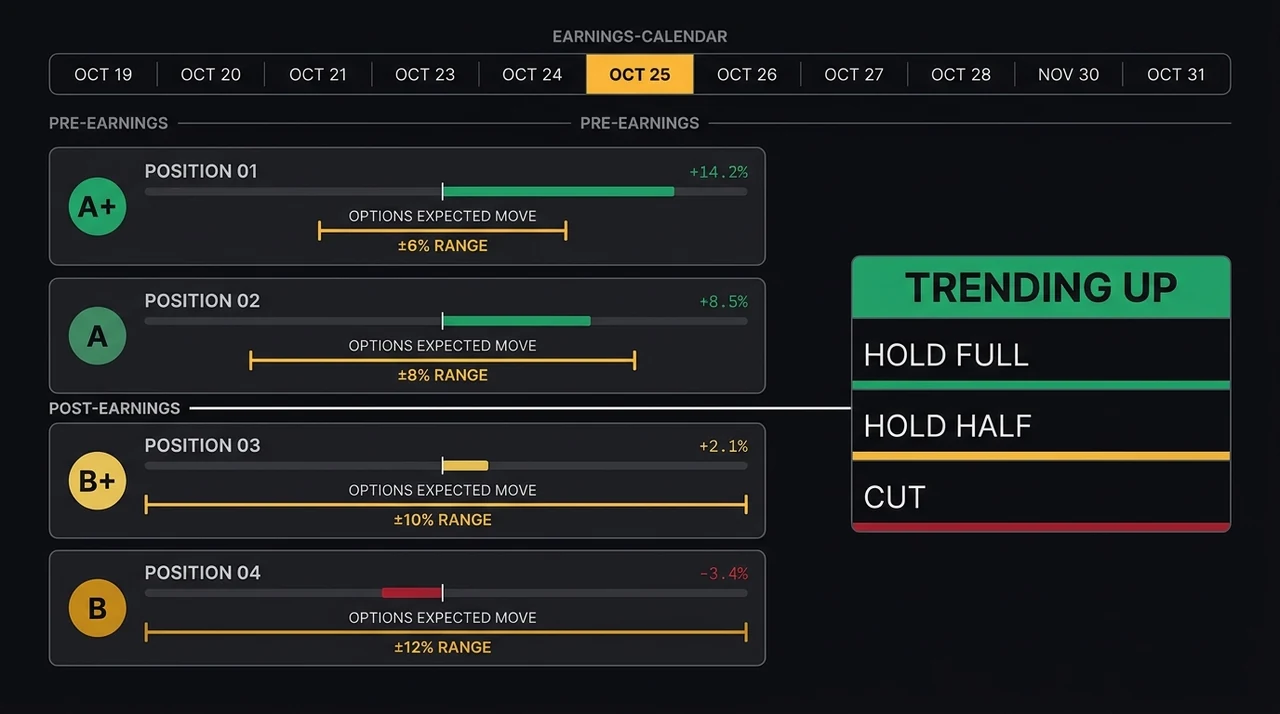
Every EasySwing setup carries an entry, a stop, and two targets (T1 and T2), plus the reward-to-risk ratio for each target. A setup's grade can also be capped when the reward remaining is thin, so a stock that has already run toward T1 scores lower than the same pattern at its trigger.
Each setup records a risk per share and a reward-to-risk figure for both targets, computed as the distance from entry to the target divided by the distance from entry to the stop. The setup card also carries a scale-out plan across the two targets.
The ratio also changes as price moves. A setup flagged with a $50.00 entry, a $47.00 stop and a $54.50 first target is 1.5:1 at the trigger. If the stock closes at $52.50 before you act, the reward left to T1 is $2.00 against $5.50 of risk to the stop, or 0.36R. EasySwing tracks this as reward remaining, measured in R from the latest close.
The grade also reflects an expected R, calculated as the estimated win probability times the reward remaining, minus the loss probability times one R. When that expected value is low, the grade is capped. Each setup is graded on the A+ / A / B+ / B / C scale. A pattern can look identical on the chart and still earn a lower grade because the remaining reward no longer pays for the risk.
None of this predicts which trades will win. It is a way to compare candidates by the arithmetic the trade offers now, and results are published either way at /track-record. The sizing side of the same math, shares per trade given a risk amount, is in the position sizing guide.
Common Mistakes With Risk Reward Ratios
The ratio fails in predictable ways. Most come from treating a planned number as a result, or from adjusting inputs until the trade looks acceptable. Each mistake below has a simple check.
Moving the target to improve the ratio. A target placed above overhead resistance makes the ratio look better and makes the target less likely. The ratio is only as good as the probability attached to it. Check that a prior high, gap or consolidation does not sit between entry and target.
Placing the stop too tight to inflate the ratio. A stop inside the stock's normal daily range raises the ratio and lowers the win rate in step, often by more than the ratio gain. The ATR indicator guide shows how to measure normal range, and the stop loss guide covers where a stop belongs.
Ignoring the win rate. A strategy with a 4:1 plan and an 18% win rate loses money. Measure the win rate on at least 50 to 100 trades, from a trading journal or a properly run backtest, before relying on any ratio.
Treating the planned ratio as the realized one. Gaps through the stop, partial fills and early exits all lower the realized average win and raise the realized average loss. Track the realized R of every closed trade and compare it with the plan.
Stacking correlated trades. Five 3:1 trades in one sector behave like one large trade, and a single bad day can stop all of them. The portfolio heat guide covers how to cap total open risk. EasySwing's house defaults cap total risk at 6% across 4 positions, adjustable by the user.
A Checklist Before You Accept a Ratio
Run these checks on every trade before relying on its ratio. Each one tests whether the numbers come from the chart or from wishful adjustment.
- ✅ Set the stop where the trade idea is invalid, before looking at the target
- ✅ Put the target at the next real obstacle: a prior high, a gap or a measured move
- ✅ Compare the ratio with the breakeven win rate for that ratio
- ✅ Check the setup's win rate on your own trade history or a test with out-of-sample data
- ✅ Recalculate the ratio from the current price, not the signal price
- ✅ Record the realized R for every closed trade
- ❌ Do not move a target higher to reach a minimum ratio
- ❌ Do not tighten a stop below normal daily range to improve the ratio
- ❌ Do not treat a high ratio as a reason to oversize the position
Frequently Asked Questions
What is a good risk reward ratio for swing trading?
Most swing traders require at least 2:1, and breakout traders often prefer 3:1. A good ratio is one your win rate can support: at 2:1 you need to win more than 33% of trades, at 3:1 more than 25%.
How do you calculate the risk reward ratio?
Subtract the stop from the entry to get the risk per share, subtract the entry from the target to get the reward per share, then divide reward by risk. A $50 entry, $47 stop and $56 target gives $6 divided by $3, a 2:1 ratio.
What win rate do you need at a 1:3 risk reward ratio?
More than 25%. The breakeven win rate is 1 divided by (1 + 3), which is 25%. After commissions and slippage the real requirement is somewhat higher, so a strategy that wins 30% of the time is a more realistic floor for a 3:1 plan.
Is a higher risk reward ratio always better?
No. Distant targets are reached less often, so a higher ratio usually comes with a lower win rate. The useful number is expectancy, which combines both, and it should be measured from many closed trades rather than assumed from the plan.
Can a 1:1 risk reward ratio be profitable?
Yes, if the win rate is clearly above 50% after costs. Mean-reversion and short-term bounce strategies often run near 1:1 and rely on a high win rate. The margin for error is thin, so costs and slippage matter more than they do at 3:1.
EasySwing screens for swing setups automatically and shows the entry, stop and two targets, with the reward-to-risk to each. For where to place the stop that defines 1R, see Swing Trading Stop Loss. For how to manage a winner after the first target, see How to Use Trailing Stops for Swing Trading, and for share-count math, see Position Sizing with R-Multiples. Scan results are for informational purposes only. See our Risk Disclaimer.
Disclaimer: This article is for educational purposes only and does not constitute investment advice. EasySwing is a stock screening tool, not a registered investment advisor. All trading involves risk. Read our full disclaimer →