MA Stack Confluence: How Perfect Moving Average Alignment Identifies Market Leaders
Jegadeesh and Titman's 1993 Journal of Finance study documented that stocks sustaining 3–12-month price momentum outperformed the market by 12.01% annually. The stocks generating that return continuously — not in a single burst, but session after session — are identifiable by one structural signal: every key moving average is aligned and rising simultaneously. This is the MA Stack Confluence.
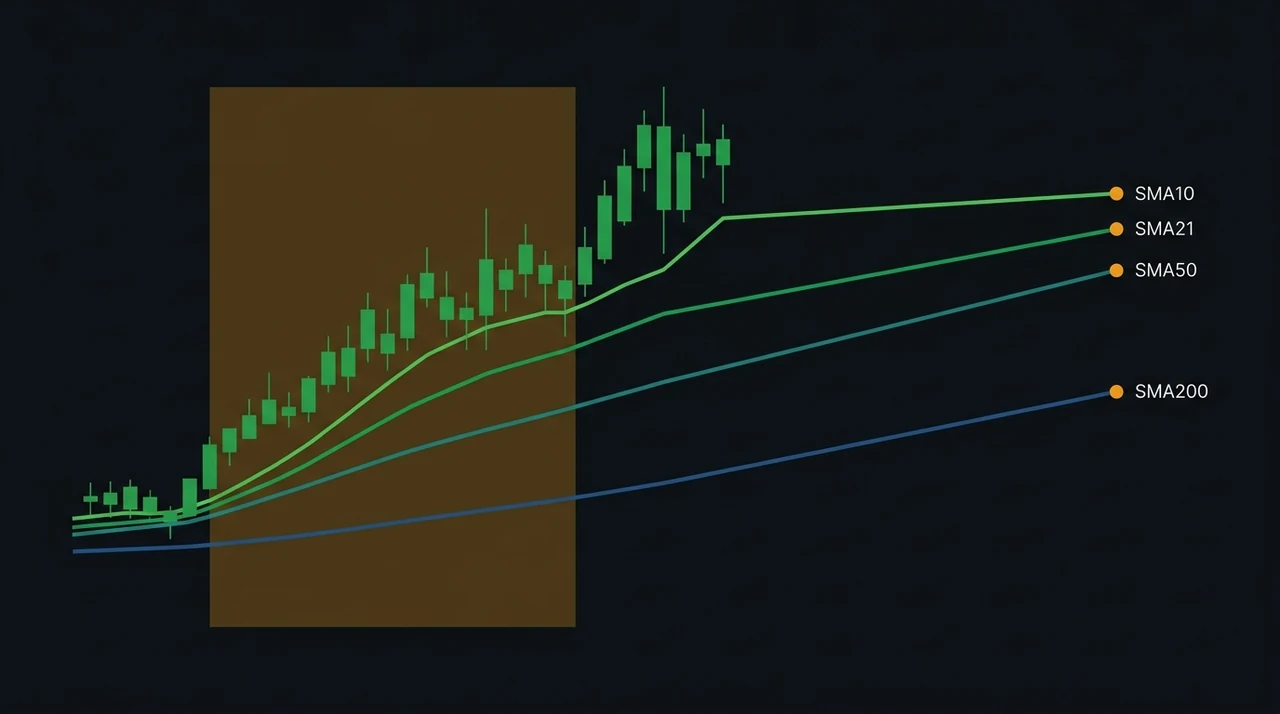
The setup fires when a stock's SMA10, SMA21, SMA50, and SMA200 are in perfect descending order — each one higher than the next — with all four slopes rising over the prior 20 sessions, the close above the SMA10, and a 3-month return of at least +8%. EasySwing's walk-forward validated implementation produced a 2.31 net profit factor across 859 holdout trades with a robustness score of 1.00.
The MA Stack Confluence Setup
Short answer: MA Stack Confluence fires when all four key moving averages — SMA10, SMA21, SMA50, and SMA200 — are stacked in perfect descending order with every one of them rising over the prior 20 sessions and the close above the stack. A +8% three-month momentum gate confirms sustained price leadership before the signal triggers.
The setup captures a structural state in which a stock's institutional footprint is visible across every relevant time frame simultaneously. When the short-term, monthly, medium-term, and long-term moving averages are all pointed upward and stacked in perfect order — each one above the next — the stock is in what Stan Weinstein (Secrets for Profiting in Bull and Bear Markets, 1988) defined as Stage 2: an advancing phase where institutional buyers dominate supply at every time horizon.
William O'Neil documented the behavioral logic in How to Make Money in Stocks (2009): the top-performing stocks trade in a moving average alignment where each shorter-period average is above every longer one, with all of them rising in unison. This state cannot exist passively — it requires continuous demand that resets daily at every institutional accumulation horizon from two weeks to one year.
MA Stack Confluence is distinct from a basic Stage 2 screen. Stage 2 requires only that price is above a rising SMA200. MA Stack Confluence adds three layers: all four SMAs in perfect descending order, each one actively rising over the prior 20 sessions, and a 3-month momentum gate confirming that price has already validated the structure with measurable returns.
The Four Moving Averages: Why Each Level Matters
Short answer: Each of the four SMAs tracks a distinct institutional time frame. SMA10 reflects two-week demand; SMA21 tracks the monthly accumulation cycle; SMA50 is the medium-term reference used by most fund managers; SMA200 divides Stage 2 from all other stages. When all four are rising in alignment, demand is building simultaneously at every horizon.
SMA10 is the most sensitive indicator of current price action. When SMA10 > SMA21, buyers in the most recent two weeks are paying more than buyers over the past month — short-term demand is accelerating above the monthly average.
SMA21 captures the monthly institutional accumulation cycle. O'Neil and IBD use the 21-day moving average rather than the 20-day because 21 sessions more accurately tracks the actual monthly trading calendar. When SMA21 > SMA50, monthly demand is running above the medium-term baseline.
SMA50 is the primary reference for institutional desks managing medium-term positions. Mark Minervini, in Trade Like a Stock Market Wizard (2013), treats the 50-day moving average as the institutional baseline for trend assessment — as long as the line is trending up and price holds above it, the primary trend stays bullish and institutions are defending their positions. When SMA50 > SMA200, the dominant institutional time frame is aligned with the long-term base.
SMA200 is the definitive dividing line between Stage 2 and every other stage. A stock with a rising SMA200 has sustained buying across a full year of institutional decision-making. Weinstein defined Stage 2 as precisely the phase in which price is above a rising 200-session moving average.
When all four sit in the order SMA10 > SMA21 > SMA50 > SMA200, every institutional accumulation horizon — from two weeks to one year — simultaneously reflects net buying. The state requires continuous active demand at each level.
The "all four rising over 20 sessions" slope requirement adds a further layer. A stock can be in correct alignment but stagnating — flat SMAs in the right order from a past uptrend that has plateaued. The slope check rejects this. Each SMA value must be higher today than 20 sessions ago, confirming that institutional interest is not merely present but actively compounding.
The Three Hard Entry Gates
Short answer: The detector applies three sequential gates — perfect SMA alignment with close above SMA10, all four slopes rising over 20 prior sessions, and a 3-month return of at least +8%. EasySwing's tuned version adds two post-signal filters — RS rank ≥ 93 and Grade A+ — concentrating output on the extreme-leaders subset.
First gate — Perfect alignment and price position. SMA10 > SMA21 > SMA50 > SMA200, and today's close is above SMA10. This gate rejects the large population of stocks in Stage 3 distribution or Stage 4 decline, where shorter SMAs can temporarily appear above longer ones as they respond first to a declining price sequence.
Second gate — All four slopes rising. Each SMA value must exceed its value from 20 sessions prior. This eliminates stocks where structural alignment is inherited from a past uptrend but accumulation has stalled. A stock in a high-level consolidation can maintain MA alignment for weeks without net institutional buying — the slope check targets this false-positive state.
Third gate — 3-month momentum ≥ +8%. The stock must have gained at least 8% over the prior 63 trading sessions. This confirms the MA structure is generating real returns. Stocks with perfect MA alignment but flat recent price action have structure without momentum — the momentum gate ensures both are concurrent.
EasySwing's walk-forward validated configuration applies two additional filters at the signal-scoring level: RS rank ≥ 93 and Grade A+. These are not detector gates — they are post-signal constraints that concentrate output on the extreme-leaders cohort. The iter-33 validation (training window: November 2022–March 2025, holdout: May 2025–April 2026) produced a 2.31 net holdout profit factor across 859 trades, a robustness score of 1.00, and a permutation p-value of 0.000.
Reading the Confluence Score
Short answer: When the base conditions are met, EasySwing calculates a six-condition confluence score. Higher scores — particularly "Super-RS leader" (RS ≥ 90) and "tight stack" (SMA10 within 10% of SMA200) — identify the strongest setups within the already-filtered universe.
The confluence score runs from 0 to 6, with each condition treated as a binary flag:
| Confluence Condition | What It Signals |
|---|---|
| Strong RS (≥ 70) | Top-30% relative strength — broad institutional endorsement |
| Strong 3-month momentum (≥ +20%) | Sustained price leadership above the +8% minimum gate |
| Tight stack (SMA10/SMA200 spread ≤ 10%) | Early-stage structure, not overextended from base |
| Super-RS leader (RS ≥ 90) | Top-decile strength — concentrated institutional buying |
| Bullish close today | Signal-day confirmation: buyers finishing the session in control |
| SMA200 rising 20+ bars | Long-term base active and accelerating, not coasting |
A score of 4–6 represents the most concurrent institutional signals. The Grade A+ filter ensures that EasySwing's pick feed shows only the highest-confluence setups.
The "tight stack" condition is particularly diagnostic. When SMA10 is within 10% of SMA200 — meaning the short-term and long-term averages are close together — the stock is typically early in a Stage 2 advance, where the full price move is still ahead. As a Stage 2 matures, SMA10 extends further above SMA200 and the stack loosens. The tight-stack flag identifies the earlier, higher-upside portion of the structural cycle. See our moving averages for swing trading guide for the full stack interpretation framework.
Entry, Stop, and Target Rules
Short answer: Entry is the prior session's high plus a 0.3% buffer. The stop is the tighter of 1.55× ATR below entry or SMA50 × 0.99 — protecting against both volatility-driven washouts and structural breaks. T1 targets 2.73× initial risk; T2 targets 3.67× initial risk. Maximum hold is 15 sessions.
Entry. The trigger price is the prior session's high multiplied by 1.003 — a 0.3% buffer above the most recent high. This prevents entering on a gap-open that immediately reverses below the previous session's high, which signals failed institutional conviction rather than genuine follow-through.
Stop. The stop is placed at the higher of two price levels: entry minus 1.55× the 14-day ATR, or SMA50 × 0.99. Using the higher value means using the tighter stop — closer to entry and closer to the invalidation point. The SMA50 structural stop captures the institutional defense level: a close below SMA50 signals that the medium-term buyer cohort has stepped aside. The 1% buffer below the SMA50 prevents exit on a routine intraday test. When the ATR-based stop lands above the structural stop, the ATR level takes precedence.
Target 1 (T1). Set at 2.73× the initial risk per share (entry minus stop). At T1, the trade has captured approximately 2.73R — roughly 2.7 times its defined risk. The 46% win rate combined with 0.60R average expectancy confirms that most winning trades comfortably reach T1 before extending further.
Target 2 (T2). Set at 3.67× initial risk. T2 targets the fuller intermediate-term trend leg implied by the institutional accumulation structure. A strong MA Stack Confluence setup — high confluence score, tight stack, super-RS — has a meaningful probability of reaching T2 before the hold limit.
Maximum hold. 15 trading sessions from the entry trigger. If neither target is reached within this window, the signal has stalled and active management applies. The 15-day limit was calibrated in the walk-forward sweep; extending it does not improve the profit factor.
MA Stack Confluence and the Market Regime Gate
Short answer: EasySwing restricts MA Stack Confluence signals to the Trending Up (Strong Bull) regime. In Bear or Choppy conditions, the four-MA alignment can appear intact on individual stocks even as broad institutional flows reverse — making individual signals structurally misleading.
The relationship between market regime and MA Stack Confluence performance mirrors the pattern observed across all momentum-based strategies: follow-through improves in trending regimes and deteriorates in choppy or declining ones. The mechanism is institutional flow. In a Trending Up (Strong Bull) regime, net inflows to equities provide a tailwind that sustains the buying pressure the MA stack requires to maintain itself. In Bear or Choppy conditions, net outflows create a broad supply overhang that acts as a headwind — even for stocks in perfect structural alignment.
EasySwing's market regime indicator computes regime from four inputs: S&P 500 trend, ADX, market breadth, and the VIX. A Trending Up (Strong Bull) reading means all four are aligned — the broad institutional flow supports individual stock accumulation.
In a Bear regime, even stocks with RS rank above 93 and perfect MA alignment eventually surrender to broad selling. The regime gate cuts MA Stack Confluence activity entirely in Bear conditions, concentrating the strategy's performance record within the subset of environments where its mechanism functions.
MA Stack Confluence Setup Checklist
Before acting on an MA Stack Confluence signal:
- ✅SMA10 > SMA21 > SMA50 > SMA200 confirmed on today's close
- ✅All four SMAs higher than 20 sessions ago — slope confirmed
- ✅Close above SMA10 — price is above the full stack
- ✅3-month return ≥ +8% — momentum gate met
- ✅RS rank ≥ 93 — extreme-leaders tuned gate
- ✅Grade A+ assigned by EasySwing quality scoring
- ✅Market regime is Trending Up or Strong Bull
- ✅Entry price, ATR stop, and SMA50 structural stop defined before entry
- ❌Enter if the SMA200 slope is flat or declining — the long-term institutional base has not been established
- ❌Enter in Bear or Choppy regime — broad market conditions undermine the accumulation mechanism
- ❌Widen the stop to "give the trade room" — the 1.55×ATR and SMA50 stops are calibrated to the invalidation point
- ❌Hold beyond 15 sessions if neither T1 nor T2 is reached — the structural thesis has stalled
Frequently Asked Questions
How is MA Stack Confluence different from the Minervini Trend Template?
The Minervini Trend Template applies eight criteria — including 52-week high/low proximity rules and RS rank gate — as a binary pass/fail screen. MA Stack Confluence focuses on one specific structural condition: all four SMAs in perfect alignment and every one of them actively rising over 20 bars. The key difference is the slope requirement — MA Stack Confluence rejects stocks where the alignment is structurally correct but accumulation has plateaued.
Why use the 10, 21, 50, and 200 SMAs specifically?
O'Neil and IBD popularized the 21-day moving average over the 20-day because 21 sessions better tracks the actual monthly trading calendar. The 10-, 50-, and 200-session windows are the standard institutional time frames for short-term, medium-term, and long-term trend assessment respectively. When all four are in alignment, the structure reflects genuine institutional decision horizons at each level.
What is the "tight stack" condition and why does it matter?
A "tight stack" means the spread between SMA10 and SMA200 is 10% or less — the four averages are bunched together rather than spread far apart. This typically occurs early in a Stage 2 advance, before price has moved significantly above all the averages. Early-stage setups tend to have more upside ahead of them than late-stage ones where the stack is already widely extended.
What minimum RS rank does EasySwing actually require for a tuned signal?
The base detector accepts RS ≥ 40, but EasySwing's walk-forward validated configuration (iter-33) tightens this to RS ≥ 93 — the extreme-leaders cohort. Both the RS gate and the Grade A+ requirement are tuned post-signal filters, not hard detector gates. They narrow the pool to the highest-conviction cases where the 2.31 net profit factor was measured on 859 holdout trades.
How does the SMA50 structural stop work alongside the ATR stop?
The stop is placed at the higher (tighter) of two price levels — entry minus 1.55×ATR, or SMA50×0.99. If SMA50×0.99 is closer to the entry price (tighter), it takes priority. If the ATR-based level is closer, that level takes priority. The SMA50 stop captures institutional invalidation: a close below SMA50 means the medium-term buyer cohort has stepped aside, ending the confluence thesis.
EasySwing.trading automatically screens for MA Stack Confluence setups across 2,000+ US equities each trading day. For more on the underlying framework, see our guides to moving averages for swing trading and Stage 2 stock analysis. Scan results are for informational purposes only. See our Risk Disclaimer.
Disclaimer: This article is for educational purposes only and does not constitute investment advice. EasySwing is a stock screening tool, not a registered investment advisor. All trading involves risk. Read our full disclaimer →