52-Week High Pullback: A Swing Trading Strategy
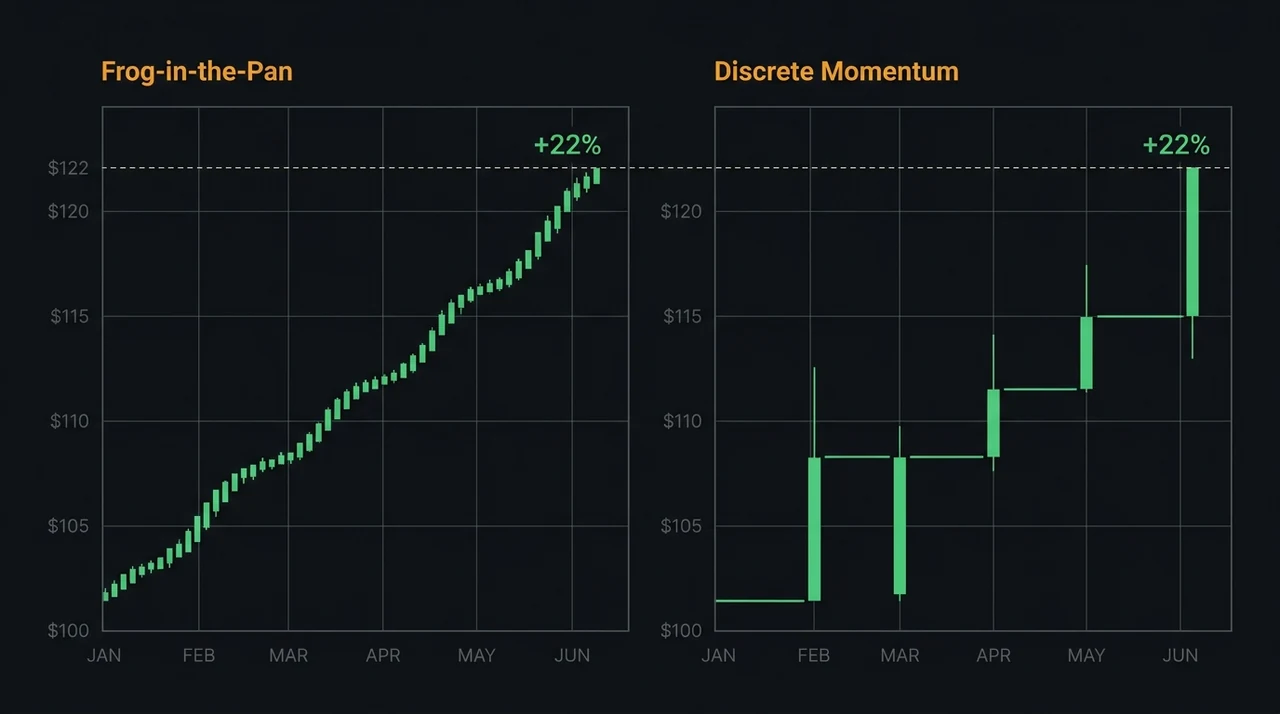
George & Hwang (2004, Journal of Finance) found that stocks trading near their 52-week high kept outperforming for months afterward — investors anchor on that recent high and under-react to news that pushes a stock closer to it. EasySwing's 52-Week-High Proximity Pullback detector adapts that anomaly to a filtered leadership cohort, not the raw universe. The current tuned-config snapshot records a 2.01 profit factor across 1,056 holdout trades in Trending Up conditions.
What Is the 52-Week High Pullback Strategy
The 52-Week High Pullback finds RS-leading stocks consolidating within 7% of their 52-week high, then buys the bounce off a tight, low-range candle. EasySwing requires RS rank in the top quintile, an uptrending 50/200-day SMA stack, and proximity to the high that is improving — not deteriorating — before a bounce candle triggers entry. The 2026 tuned configuration returned a 2.01 profit factor across 1,056 holdout trades, a 53% win rate, and +0.37R expectancy per trade.
The strategy is a hybrid of two well-documented ideas. The 52-week-high anchor comes from behavioral finance: traders use the 52-week high as a reference point and are reluctant to bid a stock past it, so price often stalls just below the level before eventually clearing it. The pullback entry shape comes from trend trading: rather than chasing a stock as it approaches that anchor, EasySwing waits for a one- or two-day pause — a low-range consolidation candle — and enters only when the stock bounces off it.
That combination distinguishes the strategy from a raw "stocks near their 52-week high" screen. A raw proximity screen returns extended stocks with no entry discipline. The pullback requirement adds a defined, lower-risk entry point within the same anomaly.
The 52-Week-High Anomaly: From Academic Curiosity to Practitioner Edge
Thomas George and Chuan-Yang Hwang published "The 52-Week High and Momentum Investing" in the Journal of Finance in 2004, one of the most-cited momentum papers of the following two decades. Their central finding: a stock's nearness to its 52-week high predicts future returns better than trailing price momentum alone — an anomaly rooted in anchoring bias, not fundamentals.
George and Hwang wrote that investors "use the 52-week high as a reference point, and their unwillingness to bid the price of the stock above this reference point... causes the stock to become undervalued." When the market eventually absorbs that resistance, the stock tends to keep advancing rather than stalling — the opposite of what a naive "already near a high, must be overbought" read would predict.
The finding replicated outside the US. Liu, Liu & Ma (2011) tested the 52-week-high effect across 20 international markets and found the anomaly held in the large majority of them, with comparable magnitude to the original US sample. Quantpedia catalogues it as strategy #52 in its database of documented anomalies — a sign the edge has survived multiple independent replications rather than being a single-study artifact.
EasySwing's implementation narrows the anomaly to a specific, tradeable sub-cohort: RS-ranked leaders in a confirmed intermediate uptrend, entered on a consolidation-and-bounce shape rather than the raw proximity signal George and Hwang studied at the whole-market level.
The Seven Conditions EasySwing Checks Before Signaling BUY
EasySwing scans a universe of liquid US equities at each market close, applying seven hard gates before a bounce candle can trigger entry.
- RS rank ≥ 80. Relative strength versus the tracked universe over the trailing six months. This tightens George and Hwang's whole-market anomaly to a leadership cohort — the sub-population EasySwing's other strategies already validate on.
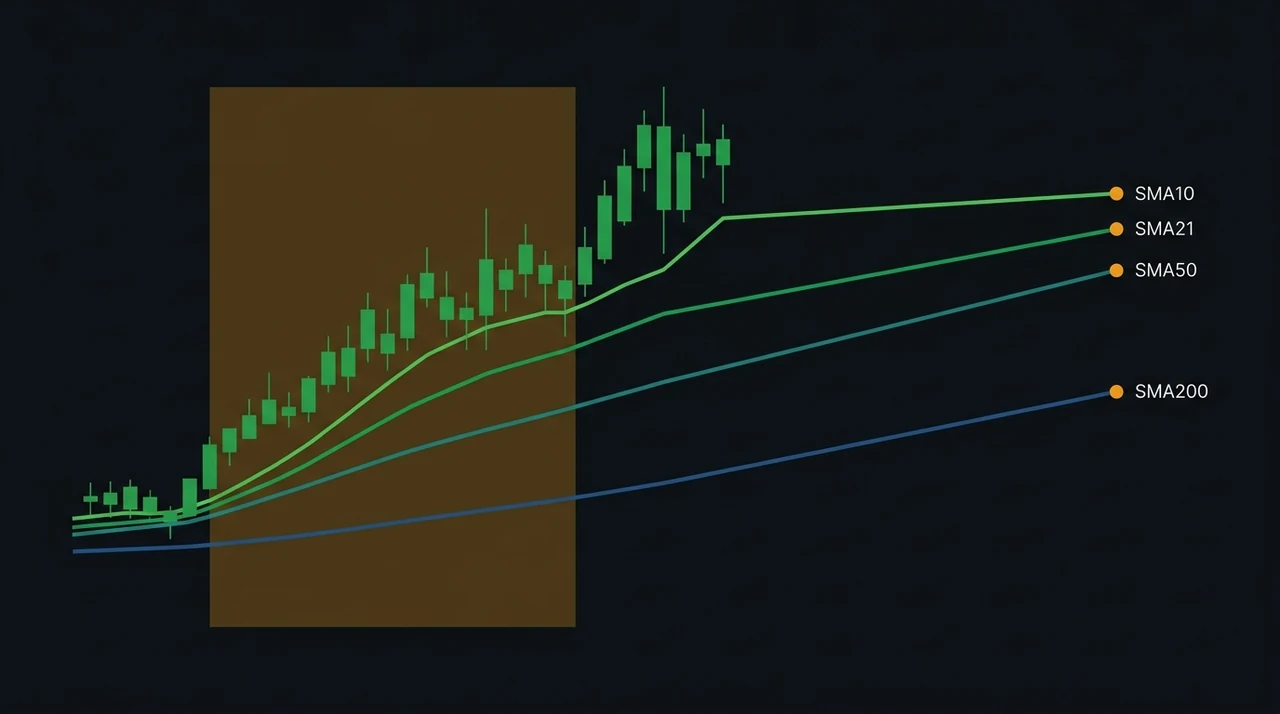
- Close > SMA50 > SMA200. The intermediate moving average sits above the long-term moving average, and price sits above both — a Stage 2-style trend confirmation that filters out stocks near a 52-week high purely from a short-term spike.
- SMA50 rising over the last 5 bars. The intermediate trend must be actively advancing, not flattening.
- Within 7% of the 52-week high. Close divided by the trailing 252-session high must be at least 0.93. This is the George & Hwang anchor — close proximity to the reference point, not a fresh breakout above it.
- Proximity improving, not deteriorating. Today's distance from the 52-week high must be no more than 2 percentage points worse than it was 20 sessions ago. The stock is climbing back toward its high, not falling away from it.
- ADX(14) ≥ 20. A standard trend-strength floor that keeps the strategy out of choppy, directionless names even when the SMA stack technically qualifies.
- Today's true range ≤ 70% of the 14-day average true range (ATR14). The consolidation-candle requirement — today's bar must be tighter than normal, the signature of a pause rather than continued volatility.
A stock meeting all seven gates prints WATCH until a bounce candle confirms: today's high must exceed the prior bar's high, today's close must exceed the prior close, and the close must land in the upper half of today's range. Only then does the signal upgrade to BUY. EasySwing's live pick-selection floor tightens the RS gate further to RS ≥ 90, based on the tuned holdout evidence below — a stricter bar than the detector's raw RS ≥ 80 hard gate.
EasySwing's Backtest Results
EasySwing validated the 52-Week High Pullback using a walk-forward methodology: parameters were tuned on a training window (November 2022–March 2025), then measured on a holdout window (May 2025–April 2026) the tuning procedure never touched.
Holdout period results (Trending Up regime):
| Metric | Holdout |
|---|---|
| Holdout period | May 2025 – Apr 2026 |
| Trades | 1,056 |
| Profit factor (net of fees) | 2.01 |
| Win rate | 53% |
| Average expectancy | +0.37R per trade |
| Robustness score | 0.92 |
| Permutation p-value | 0.000 |
The strategy produced a 2.01 profit factor net of fees ($1.50/trade) and 5 bps slippage across 1,056 holdout trades — meaning gross wins outweighed gross losses by roughly two to one over the period. A 53% win rate combined with +0.37R expectancy indicates a modestly favorable, not lottery-ticket, payoff shape: slightly more than half of trades close profitable, and the average winner runs somewhat larger than the average loser.
A robustness score of 0.92 means the edge held up across the large majority of parameter variations tested in the autoresearch sweep, not just the single best-fit combination. The observed holdout performance is extremely unlikely to have occurred by chance (p-value of 0.000), which is the standard statistical bar EasySwing applies before crediting a strategy as tuned rather than dead or inconclusive. The training window produced a 1.33 profit factor over 3,796 trades — a deliberately conservative tuning window — and the holdout improvement to 2.01 suggests the filters generalize to new data rather than overfitting the training period.
The strategy currently carries a Beta tag in EasySwing's strategy picker while it accumulates more live holdout history, consistent with how the platform labels every strategy still building its post-launch track record.
Trade Structure: Entry, Stop, and Targets
Entry: Placed 0.5% above the prior bar's high (entry = prior high × 1.005), taken on a confirmed bounce candle. A stock meeting the seven gates but lacking a bounce prints WATCH, not BUY.
Stop: The higher (tighter) of two references — 2.26× ATR14 below entry, or 1% below the lowest low of the trailing 10 sessions. The structural low reference keeps the stop from sitting unnecessarily far below price in a clean, shallow consolidation; the ATR reference caps risk in higher-volatility names. Account-level position size is user-managed; the detector does not enforce a 1% equity-risk rule.
Targets (R = per-share risk: entry minus stop):
- T1: Entry + 2.55R — partial exit
- T2: Entry + 4.29R — full exit, capturing the extended leg of the move
The tuned backtest uses a maximum hold of 21 sessions. That is a simulation and strategy-metadata parameter, not a claim that EasySwing automatically closes a user's brokerage position.
52-Week High Pullback vs Trend Pullback vs HHV Breakout
All three strategies enter on a pause within an existing uptrend, but the anchor each one measures the pause against is different.
| Dimension | 52-Week High Pullback | Trend Pullback | HHV Breakout |
|---|---|---|---|
| Reference point | 52-week high (within 7%) | EMA9/EMA20 zone | 20-day highest high |
| Trend filter | SMA50 > SMA200, rising | Established uptrend | Stage 2 (SMA50 > SMA200) |
| Entry trigger | Bounce off consolidation candle | Bounce off moving-average zone | Single-bar channel break |
| RS rank floor (live) | 90 | Strategy-specific | 81 |
| Win rate (holdout) | 53% | Strategy-specific | 52% |
| Expectancy (holdout) | +0.37R | Strategy-specific | +0.63R |
| Max hold | 21 days | Strategy-specific | 23 days |
The Trend Pullback strategy measures the pause against a short-term moving-average zone, which fires more often but on a noisier reference level. The HHV Breakout skips the pause entirely and buys the moment price clears its 20-day channel. The 52-Week High Pullback sits between them: it requires a stock to already be a leader near its longer-term high, then waits for the same kind of tight consolidation the Trend Pullback looks for before entering.
Practitioners can combine all three: HHV Breakout for stocks clearing a fresh short-term range, Trend Pullback for a dip into the moving-average zone, and the 52-Week High Pullback for leaders consolidating just under their yearly high before the next leg.
52-Week High Pullback Trading Checklist
Run this checklist before acting on any 52-Week High Pullback setup EasySwing surfaces:
- ✅RS rank ≥ 90 (live pick-selection floor)
- ✅Close > SMA50 > SMA200, with SMA50 rising over the last 5 bars
- ✅Within 7% of the 52-week high, and that distance improving over 20 bars
- ✅ADX(14) ≥ 20
- ✅Today's range ≤ 70% of the 14-day average true range (ATR14)
- ✅Bounce candle confirmed — high above prior high, close above prior close, close in upper half of range
- ✅Stop placed at the higher of entry − 2.26×ATR14 or 1% below the 10-session low
- ✅Position size chosen under your own account-level risk rule
- ❌Enter on a WATCH signal before the bounce candle confirms
- ❌Chase entries well above prior high × 1.005 — use a limit order
- ❌Treat the 21-session backtest parameter as an automatic broker exit
- ❌Describe Transitioning as a point between bullish and bearish regimes
Frequently Asked Questions
What is the 52-week-high effect in stock trading?
The 52-week-high effect is a momentum anomaly documented by George & Hwang (2004): stocks trading near their 52-week high tend to keep outperforming, because investors anchor on the level and under-react to news that pushes price toward it. Liu, Liu & Ma (2011) replicated the effect across 20 international markets. EasySwing's 52-Week High Pullback trades a filtered, leadership-only version of this anomaly.
Why does EasySwing wait for a pullback instead of buying stocks near their 52-week high directly?
A raw "near the 52-week high" screen returns extended stocks with no defined entry point or risk level. The pullback requirement — a low-range consolidation candle followed by a bounce — gives the strategy a specific entry price, a structural stop reference, and a moment where the stock has already paused rather than being chased at an arbitrary point in its run.
How is the 52-Week High Pullback different from the Trend Pullback strategy?
Trend Pullback measures the pause against a short-term EMA9/EMA20 zone, which can fire on stocks well below their yearly high. The 52-Week High Pullback specifically requires the stock to already be within 7% of its 52-week high with improving proximity — a stricter leadership filter tied to the George & Hwang anomaly rather than a general moving-average dip.
Does the 52-Week High Pullback work in bear or choppy markets?
The holdout evidence is specifically for Trending Up regimes. The live regime policy also allows a Trending-Up strategy during the direction-neutral Transitioning state when the candidate meets the B+ grade floor; that does not turn Transitioning into a bullish regime or extend the validation evidence. Ranging, Trending Down, and High Volatility are not valid states for this strategy. See the market regime guide for the five categorical states.
How do I set alerts for 52-Week High Pullback setups in EasySwing?
In the Alerts panel, create an alert targeting the 52-Week High Pullback strategy. EasySwing evaluates the full universe at each market close and delivers a notification — email, push, or Telegram — when a qualifying bounce candle confirms. See the swing trading alerts guide for the full setup process.
EasySwing.trading automatically detects 52-Week High Pullback setups — RS leaders consolidating within 7% of their 52-week high with a confirmed bounce — at each market close. For related trend-entry strategies, see the Trend Pullback guide and the HHV Breakout strategy. Scan results are for informational purposes only. See our Risk Disclaimer.
Disclaimer: This article is for educational purposes only and does not constitute investment advice. EasySwing is a stock screening tool, not a registered investment advisor. All trading involves risk. Read our full disclaimer →