PEG Ratio: What It Means for Stock Screening
Peter Lynch's shorthand from One Up On Wall Street (1989): a fairly priced growth stock trades at a P/E ratio close to its earnings growth rate. The PEG ratio turns that comparison into a number — P/E divided by annual EPS growth — so a stock on a 20 P/E growing earnings 20% a year scores a PEG of 1.0, while the same P/E on 10% growth scores 2.0, twice as expensive per unit of growth.
A high P/E alone does not tell you whether a stock is expensive. It says nothing about how fast earnings are growing to catch up with the price. The PEG ratio is the correction — a one-line filter that prices growth into the multiple instead of ignoring it.
Two unrelated things share this acronym. This guide covers the fundamental Price/Earnings-to-Growth ratio. EasySwing also has a named technical setup called Power Earnings Gap (PEG) — an earnings-gap breakout strategy that has nothing to do with valuation multiples. If a search brought you here looking for the breakout setup, that guide is the one you want.
What the PEG Ratio Measures
The PEG ratio divides a stock's price-to-earnings (P/E) ratio by its expected annual earnings-per-share growth rate, expressed as a plain number with the percent sign dropped from the growth figure. A PEG near 1.0 means the market is pricing the stock's growth roughly in line with its multiple. Below 1.0 suggests growth priced cheaply relative to the P/E; above 2.0 typically flags growth priced expensively.
The formula: PEG = P/E ÷ Annual EPS Growth Rate (%). A stock at a 25 P/E with 25% expected annual EPS growth scores 25 ÷ 25 = 1.0. The same 25 P/E on 10% growth scores 25 ÷ 10 = 2.5 — the multiple did not change, but the price paid per unit of growth roughly doubled.
How to Calculate the PEG Ratio
Pull two numbers for the stock: the trailing or forward P/E ratio, and an annual EPS growth rate — either the trailing multi-year average or a forward consensus estimate. Divide the first by the second.
| Stock | P/E | EPS Growth | PEG | Read |
|---|---|---|---|---|
| A | 15 | 30% | 0.50 | Growth priced cheaply |
| B | 25 | 25% | 1.00 | Fairly priced |
| C | 40 | 15% | 2.67 | Growth priced expensively |
| D | 60 | 60% | 1.00 | High multiple, but growth matches it |
Stock D is the case that trips up P/E-only screens. A 60 P/E looks expensive by almost any absolute threshold, but paired with 60% growth it scores the same PEG as a 25 P/E growing 25%. The PEG ratio is what separates an expensive stock from an expensive-looking one.
Trailing versus forward growth changes the answer. A PEG built on last year's growth rate can look cheap for a company whose growth is decelerating into next year, and expensive for one accelerating out of a slow prior year. William O'Neil's CANSLIM framework — covered in our CANSLIM screener guide — solves this by requiring both a strong trailing multi-year average and current-quarter acceleration, rather than trusting a single growth number in either direction.
What Counts as a Good PEG Ratio
Lynch's original heuristic treats a PEG of 1.0 as fair value, below 1.0 as undervalued relative to growth, and above 2.0 as overvalued. These are rules of thumb, not hard cutoffs, and the acceptable range shifts by sector — capital-light software and biotech names routinely trade at PEGs that would look absurd on an industrial or bank stock, because the market extends more benefit of the doubt to categories with a longer history of sustained double-digit growth.
Mark Minervini's SEPA methodology, detailed in Trade Like a Stock Market Wizard (2013), sets a floor of 20%+ annual EPS growth before a stock is even considered for a growth-momentum watchlist — the growth side of the PEG equation has to clear that bar regardless of what the resulting ratio says about valuation. A cheap PEG built on 5% growth is not the same opportunity as a fair PEG built on 40% growth; the ratio alone strips out that context.
PEG Ratio vs. P/E Ratio
| P/E Ratio | PEG Ratio | |
|---|---|---|
| What it measures | Price relative to current earnings | Price relative to earnings and growth rate |
| Best for | Comparing stocks with similar growth profiles | Comparing stocks across different growth rates |
| Blind spot | Ignores growth entirely | Assumes growth estimates are reliable |
| Typical use | First-pass valuation screen | Second-pass growth-adjusted screen |
The two ratios answer different questions. P/E asks "how much am I paying for a dollar of current earnings." PEG asks "how much am I paying for that dollar, adjusted for how fast it is expected to grow." Screening on P/E alone systematically penalizes fast-growing companies and rewards slow-growing ones that happen to look statistically cheap.
Limitations of the PEG Ratio
The PEG ratio inherits every weakness of the growth estimate it is built on. A single bad analyst forecast, one quarter of unusually easy year-ago comparisons, or a temporary demand pull-forward can distort the denominator and make a mediocre business look like a screaming bargain.
- The formula breaks down for companies with negative or near-zero earnings — there is no meaningful P/E to divide.
- It assumes linear, sustained growth. A company growing 50% off a tiny base for one more year does not carry the same durability as one compounding 15% for a decade.
- It ignores balance-sheet quality, margin trend, and debt load — a stock can carry an attractive PEG while its fundamentals are deteriorating in ways the ratio cannot see.
- Cyclical businesses distort it badly at the top and bottom of the cycle, when trailing growth rates are least representative of the normalized run rate.
Use the PEG ratio as a first-pass filter that narrows a universe, not as a standalone buy signal.
How EasySwing Surfaces the Two Halves of the PEG Ratio
EasySwing does not compute a PEG ratio or let you filter by one directly — worth stating plainly rather than implying otherwise. What it does surface: P/E is displayed on every stock's detail panel in StockFinder, and a minimum EPS-growth (quarter-over-quarter) filter is available as a direct input, mirroring the 20%+ floor CANSLIM and SEPA both use for the "C" criterion.
That split reflects how the underlying engine works. EasySwing's thirteen named strategies are technical — RS rank, Stage 2 structure, volume, and pattern confluence drive the grade. None of them reads P/E or EPS growth as a scored input. Fundamentals are enrichment data attached to every stock, available to filter and read, but not wired into the strategy engine the way ATR-based stops or RS rank are.
In practice, approximating a PEG-style screen in EasySwing today is a two-step manual process: set the minimum EPS-growth QoQ filter (20% is the CANSLIM/SEPA baseline), run the scan, then check the P/E figure on each surviving candidate to judge whether the multiple looks reasonable against the growth rate you just filtered for. It is not a single computed number, but the two inputs are both one click away.
PEG Ratio and CANSLIM: A Natural Pairing
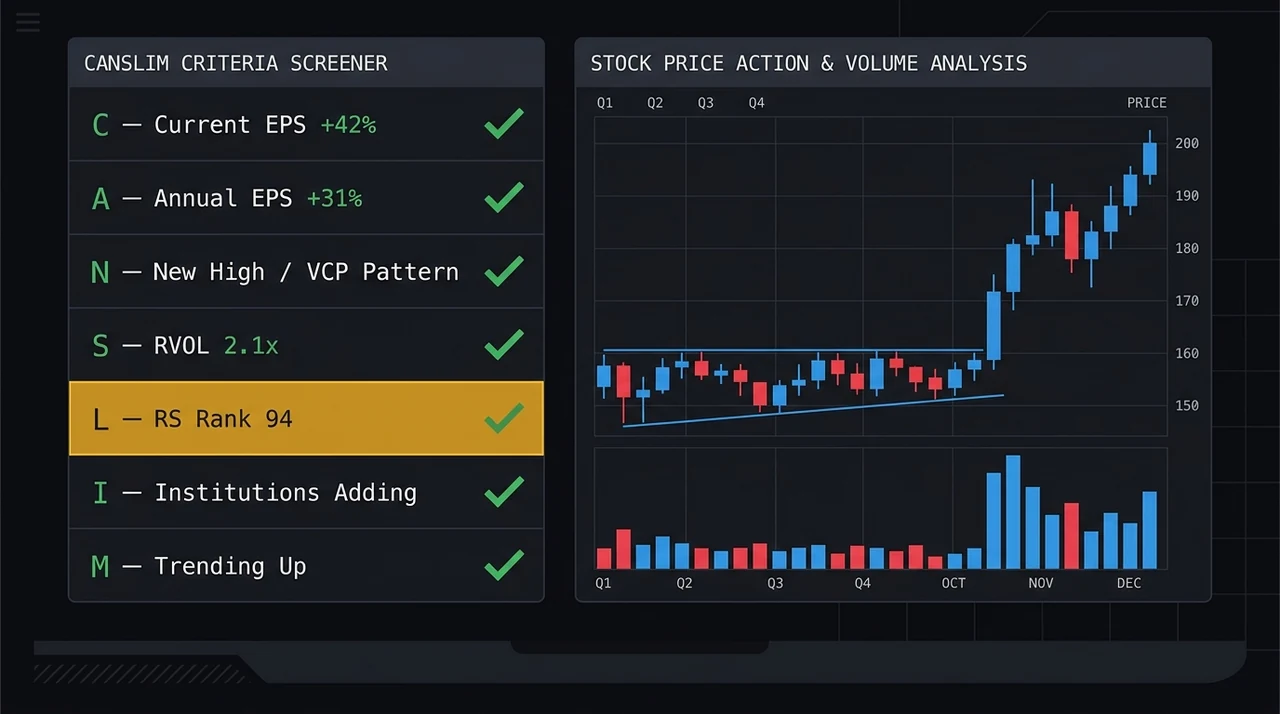
O'Neil's CANSLIM "C" and "A" criteria both demand accelerating EPS growth — 25%+ in the most recent quarter, sustained over multiple years. A stock that clears that bar and still trades at a moderate P/E is exactly the profile a low PEG is meant to flag. Running a CANSLIM-style earnings pre-filter first, then checking PEG on the survivors, catches growth stocks the market has not yet fully repriced — see the full workflow in our CANSLIM screener guide.
PEG Ratio Checklist
- ✅Confirm the P/E is calculated on positive, non-distorted earnings before dividing
- ✅Use a growth rate you trust — ideally both trailing multi-year and forward consensus, not just one
- ✅Treat 1.0 as a rough fair-value anchor, not a hard buy/sell line
- ✅Cross-check sector norms — a "high" PEG in banking may be a normal PEG in software
- ✅Pair PEG with a technical entry trigger rather than buying valuation alone
- ❌Don't apply PEG to unprofitable or pre-revenue companies
- ❌Don't trust a single quarter's growth spike as the denominator
- ❌Don't ignore debt, margins, and cash flow just because the PEG looks attractive
- ❌Don't treat PEG as a timing signal — it flags value, not entry price
Frequently Asked Questions
What is a good PEG ratio?
A PEG near 1.0 is the traditional fair-value anchor from Peter Lynch's original framework: below 1.0 suggests growth priced cheaply, above 2.0 typically flags growth priced expensively. Treat both thresholds as heuristics that shift by sector rather than universal cutoffs — high-growth software and biotech names routinely clear 1.5-2.0 without being mispriced.
How do you calculate the PEG ratio?
Divide the stock's P/E ratio by its expected annual EPS growth rate, with the growth rate expressed as a plain number (20% growth becomes 20, not 0.20). A 30 P/E on 30% growth produces a PEG of 1.0. Analysts differ on whether to use trailing multi-year growth, forward consensus estimates, or a blend of both — the choice can meaningfully change the result for companies with decelerating or accelerating trends.
Is a PEG ratio below 1 always undervalued?
Not automatically. A low PEG can also mean the market has correctly priced in a growth rate that will not hold — a temporary earnings spike, an easy year-ago comparison, or an unsustainable one-time catalyst. Confirm the growth number is durable (multi-quarter, not one print) before reading a low PEG as a bargain.
Does EasySwing screen for PEG ratio automatically?
No. EasySwing displays P/E per stock and offers a minimum EPS-growth (QoQ) filter in StockFinder, but it does not compute a combined PEG value or use fundamentals as a scored input in any of its named technical strategies. Approximating a PEG-style screen today means setting the EPS-growth filter, then checking each candidate's P/E manually.
Is the PEG ratio the same as EasySwing's Power Earnings Gap strategy?
No — they share an acronym and nothing else. The PEG ratio covered on this page is a fundamental valuation metric (P/E divided by earnings growth). EasySwing's Power Earnings Gap is a technical breakout setup that triggers on a 5%+ earnings-driven price gap with volume confirmation. Neither one is derived from the other.
EasySwing displays P/E and lets you filter by EPS growth in StockFinder across 2,000+ US equities each session, though it does not compute a combined PEG value. For the fundamental side of a CANSLIM-style workflow, see our CANSLIM screener guide, and for the general screener mechanics, our screener walkthrough. Scan results are for informational purposes only and do not constitute investment advice. See our Risk Disclaimer.
Disclaimer: This article is for educational purposes only and does not constitute investment advice. EasySwing is a stock screening tool, not a registered investment advisor. All trading involves risk. Read our full disclaimer →