Industry Group Rotation: How to Find Swing Trading Setups in Leading Sectors
William O'Neil studied the 600+ biggest stock market winners from 1953 to 2008. His conclusion: roughly 37% of a stock's price move is attributable to the strength of its industry group (How to Make Money in Stocks, 4th ed., 2009). That is not a minor modifier — it is the single largest identified driver after the broad market itself. Picking the right stock in the wrong group is a structural disadvantage.
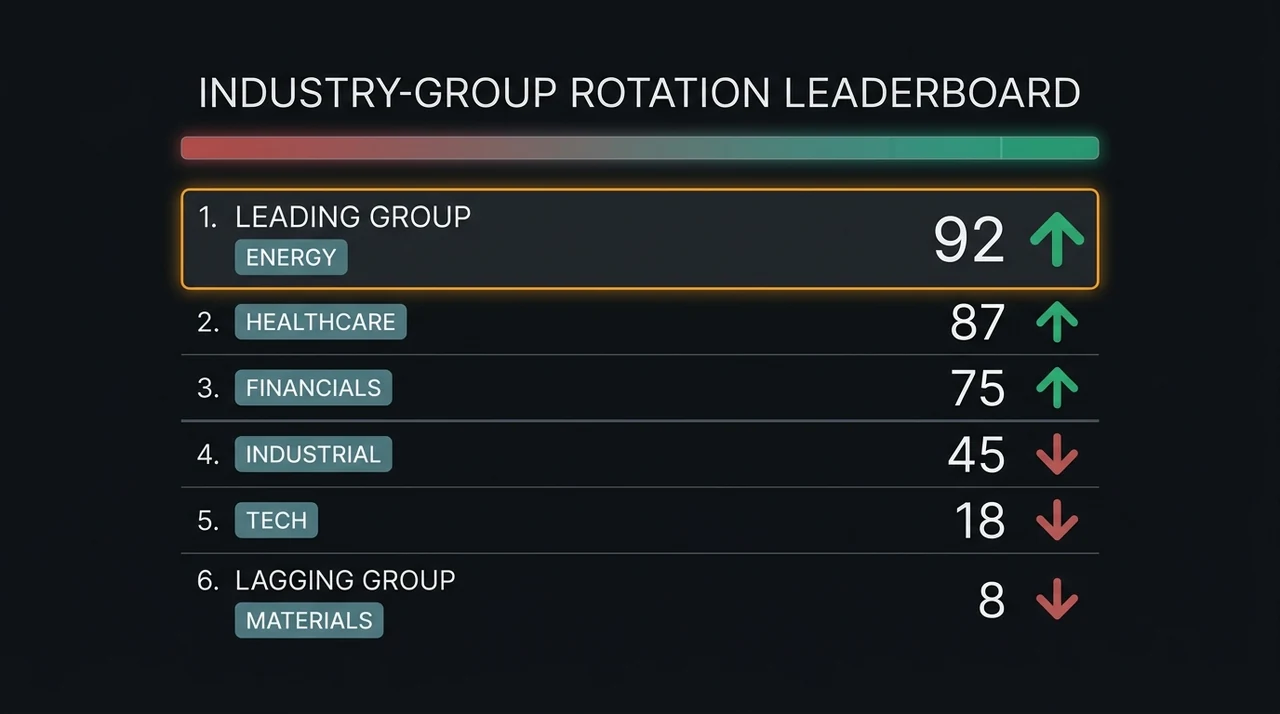
EasySwing's industry group rotation tracker ranks every qualifying group by median relative strength, refreshed twice each trading day — around midday and after the close. The leading groups show where institutional money is flowing right now. Check them before you screen for individual setups.
What Is Industry Group Rotation
Industry group rotation describes the pattern in which institutional capital shifts from weaker to stronger sectors over the course of a market cycle. At any moment, some groups are accelerating (gaining relative strength vs the index), some are distributing, and some are lagging badly. The rotation is not random — it follows institutional buying programs that can take months to play out fully.
When large funds increase allocation to a sector — semiconductors, energy, biotechnology, financials — the buying pressure lifts multiple stocks within the group simultaneously. This creates the conditions in which breakout setups cluster: a rising tide of institutional money makes it easier for individual stocks within the group to clear resistance levels and sustain the move afterward.
Why Industry Groups Drive Individual Stock Returns
O'Neil's 37% finding translates directly into screening decisions. A stock in a lagging group carries a structural headwind even when its own chart looks ideal — the same relative strength rank, the same pattern, the same volume confirmation, but sector-level selling pressure undermining the setup.
Moskowitz and Grinblatt (1999), studying U.S. equities in the Journal of Finance paper "Do Industries Explain Momentum?", found that industry momentum explains a substantial portion of the individual stock momentum anomaly. Stocks do not outperform in isolation — they outperform as part of a group that institutional buyers have chosen.
Two mechanisms drive the effect:
Sector allocation decisions come first. Large funds set target weights for each sector before selecting individual stocks. When a fund increases its technology exposure from 22% to 28%, it buys technology stocks regardless of individual chart conditions. The institutional demand elevates the entire group simultaneously.
Analyst coverage follows group momentum. Earnings estimate revisions cluster within industry groups. When semiconductor demand rises, analysts revise estimates for multiple names in the space at once. The earnings revision wave lifts valuations across the group, adding a fundamental tailwind that compounds technical breakouts.
This is why O'Neil's methodology filters not just by RS Rank and chart pattern but also by the strength of the company's industry group. A stock in a top-50 group, all other factors equal, has a materially higher probability of following through on a breakout than the same setup in a bottom-50 group.
How to Read Group Rank and Trend Signals
EasySwing ranks qualifying industry groups by their median RS score — the same relative strength metric applied to individual stocks, applied to the group as a whole. Each group receives a rank from 1 (strongest) to the total number of ranked groups, plus a trend arrow indicating whether the group's percentile rose, fell, or held flat vs the prior cycle.
| Rank Zone | Percentile | Interpretation |
|---|---|---|
| Top 20% | 80–100 | Leading — institutional demand is active |
| 20–50% | 50–79 | Neutral — mixed flows, not a primary source of breakouts |
| Bottom 50% | 0–49 | Lagging — wait for evidence of reversal before adding exposure |
The trend signal is the piece worth acting on first. A group at rank 25 that was at rank 45 three weeks ago is accelerating — early-stage rotation is underway. The biggest moves often come during the acceleration phase, not after the group reaches rank 1. A group that has held the top rank for eight consecutive weeks is mature; the bulk of the move has already played out.
Three signals worth acting on:
- Rising trend, top 30%: Highest-probability zone. Breakout setups from this group carry an institutional tailwind.
- Rising trend, 30–60%: Worth monitoring. The group is building strength but not yet confirmed as a leader.
- Falling trend or bottom 40%: Reduce exposure. Technically valid setups from lagging groups fail at a higher rate due to sector-level selling pressure.
Applying Group Rotation to Your Swing Trading Screener
The practical workflow: check the group rotation data first, then screen for setups within the leading groups. This takes under two minutes and provides sector context before you assess a single chart.
Step 1: Check leading groups. Visit EasySwing's live group rotation page and note the top 5–8 groups ranked in the top 25% and showing a rising or flat trend. These are your active sectors for the current session.
Step 2: Cross-check with market regime. Market regime is the outer gate — group rotation signals are most reliable in a Trending Up regime. In a Transitioning or High Volatility regime, reduce position sizing even if a group shows strong relative strength.
Step 3: Screen within leading groups. In EasySwing's stock screener, filter for stocks in the identified leading groups. Apply standard entry criteria: RS Rank above 85, Stage 2 trend structure, named strategy pattern (VCP, bull flag, momentum breakout). A setup from a top-10 group at A-grade quality is a higher-conviction trade than the same setup from a neutral-rank group.
Step 4: Check alignment quality. Group + regime + grade alignment is the highest-quality scenario. When all three align, the setup has the most confluent context. When the group is lagging, do not enter regardless of how clean the individual chart appears. Position size is always determined by stop distance × risk% — not by alignment tier.
Step 5: Monitor group trend weekly. A group you identified as leading three weeks ago may have started fading. Check the trend arrow weekly and tighten stops in groups where trend has shifted from rising to falling.
See the swing trading strategies guide for how each named setup applies within a group-filtered workflow.
Common Mistakes Traders Make With Sector Rotation
Most traders either ignore group rotation entirely or apply it at the wrong moment. These four errors cause avoidable losses.
Chasing mature rotation. A group that has held rank 1–3 for eight consecutive weeks is not a rotation opportunity — it is the result of one. The best entry windows are when a group is rising from rank 40 to rank 15, not when it is already at rank 2. Late-cycle entries in dominant groups carry elevated risk of sudden sector unwinds when institutional buyers begin distributing.
Ignoring the regime gate. Group rotation signals fail significantly more often in choppy or declining markets. Even a clearly accelerating group produces lower-probability breakouts when the broad market is under distribution. Apply the regime gate first, always.
Buying laggard groups on a bounce. Mean-reversion logic — "this group has been down so much it must bounce" — is a different strategy with different entry signals and a different risk profile. A lagging group with one week of rising trend is not yet a momentum leader. Wait for it to reach the top 40% percentile zone with two or more rising-trend cycles before treating it as a breakout candidate.
Overconcentrating in one sector. A fully aligned signal in semiconductors is compelling — but putting four of five open positions in semiconductor stocks concentrates all your risk in a single sector. When the sector rotates out, all positions move together. Cap sector concentration at 2–3 open positions per group, regardless of how strong the signal appears.
Industry Group Rotation Checklist
Run through this before opening any new position to confirm the group context supports the trade.
- ✅Check EasySwing's group rotation page — target stock's industry group is in the top 30% percentile
- ✅Group trend signal is rising or flat (not falling)
- ✅Market regime is Trending Up or Transitioning (regime guide)
- ✅Individual stock RS Rank is above 85 within the group
- ✅Setup matches a named strategy with a defined entry, stop, and target
- ✅Position is sized for 1R risk — no more than 1–1.5% of account equity at risk on the stop
- ❌Do not enter a setup whose industry group is in the bottom 40% percentile
- ❌Do not chase a group that has held rank 1–3 for more than six weeks without pause
- ❌Do not ignore a deteriorating group trend in an open position (rising → flat → falling)
- ❌Do not concentrate more than 2–3 open positions in a single industry group
- ❌Do not apply group rotation logic when market regime is Trending Down or High Volatility
Frequently Asked Questions
How often do EasySwing's industry group rankings update? Group rankings update after each market COMPILE cycle — twice per trading day, around midday and after the market close. The trend arrow reflects the change vs the prior cycle. Meaningful rank shifts (more than 5 percentile points) typically take 3–10 trading sessions to register a sustained trend signal.
How many groups does EasySwing track? The number varies with how many stocks currently carry a relative-strength rank and how they cluster by industry. EasySwing requires a minimum of three qualifying stocks per group before including it in the ranking — thinner groups are excluded as statistically unreliable. Because the count shifts as the data updates, the live groups page always shows the current set of ranked groups.
Does sector rotation work in a bear market? Long-side rotation — buying breakouts in leading groups — has a significantly lower success rate in Trending Down or High Volatility regimes. Broad market selling pressure overwhelms most group-level tailwinds. The correct response is to reduce overall position count and size, not to chase the "least bad" sector. Short-side group rotation (leading the downside in lagging groups) follows different entry criteria.
What is the difference between sector rotation and industry group rotation? Sectors are broad classifications (Technology, Health Care, Energy). Industry groups are narrower sub-classifications — Technology contains Software, Semiconductors, Hardware, and IT Services as distinct groups, each with different relative strength profiles. Two stocks in the Technology sector can be in very different group momentum situations. EasySwing tracks group-level data, not just sector-level, for precisely this reason.
Can I use group rotation data to time exits? Yes. A deteriorating group trend — where a group drops from rising to flat to falling over consecutive cycles — is a useful early warning to tighten stops or reduce size. It is not a sell trigger on its own, but persistent group deterioration reduces the probability of a stock reaching its price target. Pair it with individual chart action (a close below a key moving average, declining volume on attempted rallies) for a more complete exit signal.
EasySwing tracks industry group rotation automatically, ranking groups by median relative strength and showing leading and lagging sectors on the live groups page. For setup screening within leading groups, see the stock screener guide. For market context, check the regime guide. Scan results are for informational purposes only. See our Risk Disclaimer.
Disclaimer: This article is for educational purposes only and does not constitute investment advice. EasySwing is a stock screening tool, not a registered investment advisor. All trading involves risk. Read our full disclaimer →