We Found Our Backtests Were Inflating Expectancy
Our Backtests Were Overstating Every Grade's Edge. Here's What We Found and Fixed.
R-multiple is the standard unit for measuring a swing trade's result: the profit or loss expressed as a multiple of the initial risk (entry minus stop, times shares). It is a good unit — until the risk denominator gets artificially small. EasySwing.trading found that a subset of backtested trades had a stop distance close to zero (a stock barely moved before the stop calculation ran), which inflates the R-multiple on any subsequent move regardless of how small that move actually was. We call this a degenerate-risk trade, and it was quietly overstating expectancy across every setup grade.
This post documents the bug, the fix, and the corrected numbers — including the part of the correction that overturned our own prior tier ordering.
How a Small Denominator Inflates a Backtest
R-multiple divides dollar profit by dollar risk-per-share; when the risk-per-share is near zero, even a tiny price move produces an oversized R reading that has nothing to do with real trade quality. A trade risking $0.05/share that gains $0.50/share reads as +10R — a number that looks like a home-run trade but is really a measurement artifact from an almost-zero stop distance.
This matters specifically for swing setups, where the stop is typically placed at a recent structural level (a prior low, a moving average) rather than a fixed percentage. In low-volatility stocks or on entries very close to that structural level, the resulting stop distance can shrink toward zero — and every R-multiple computed off that trade balloons.
The Fix: A Degenerate-Risk Floor
The correction adds a floor under the risk-per-share denominator so no single trade's R-multiple can be inflated by an unrealistically tight stop. The floor is defined as the greater of two values: 0.25× the 14-day ATR, or 0.5% of entry price. Any simulated trade whose computed risk-per-share falls below that floor is dropped from the backtest entirely rather than clamped to the floor value — a drop, not a rescale, so the fix cannot manufacture a trade result that would not otherwise have happened.
The floor constants live in a single source location (walkForward.ts) and every one of the six simulation callers in the autoresearch pipeline — the parameter sweep, the permutation tester, two probe modules, the portfolio validator, and the cull-rate check — imports the same constants rather than re-declaring them. That centralization was itself audited as part of this correction: a floor consistency check confirmed all six callers apply an identical drop rule, so the fix is not a patch on one code path while others stay exposed.
Provenance: When Was This Actually Fixed
The floor was committed to the codebase on 2026-06-27. The empirical record used for the numbers below — the report generated from a fresh sweep — was produced on 2026-07-03, six days later. That ordering matters: the corrected numbers below are computed with the floor already active, not retrofitted onto old, artifact-inflated data. The worst-case failure mode — publishing results that still carry the inflation bug — is not in play here.
The Correction, By Grade
Comparing the floor-corrected average R-multiple against the prior (pre-floor) baseline, the effect scales with how much artifact load each grade previously carried:
| Grade | Prior artifact load | Corrected avgR | Change |
|---|---|---|---|
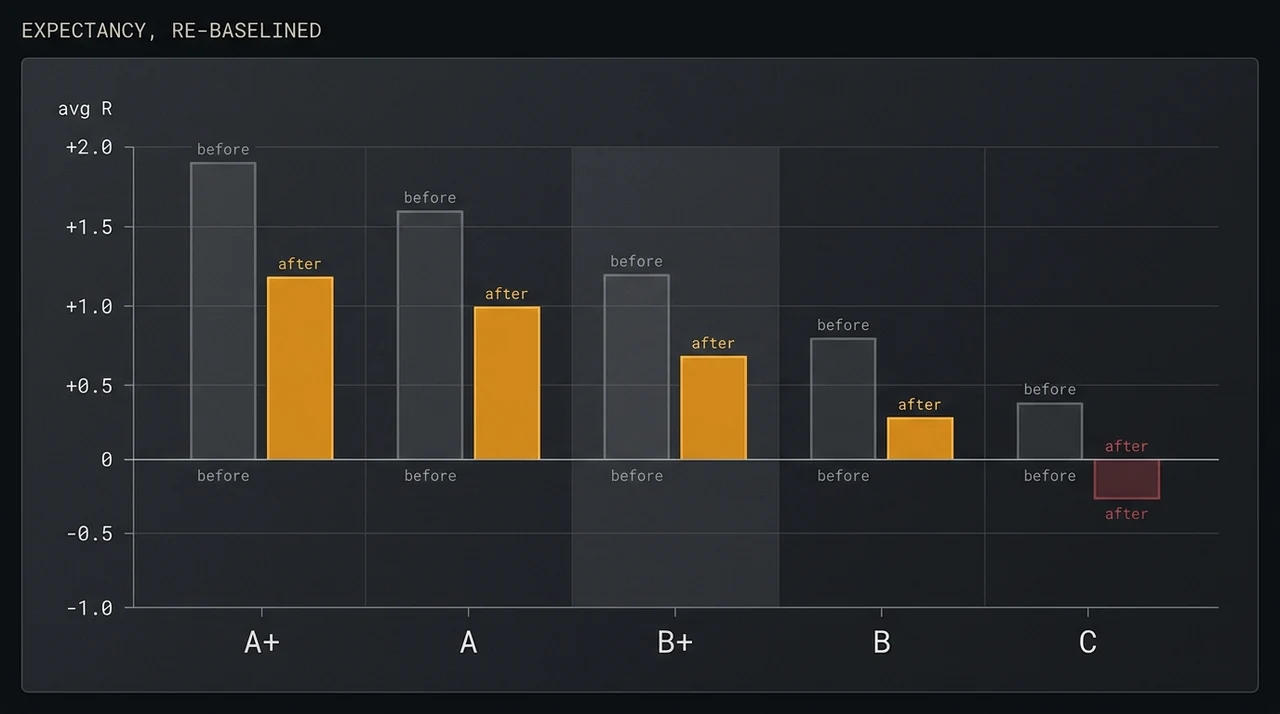
| A+ | Moderate | 0.171 | −39% |
| A | Lower | 0.153 | −64% |
| B+ | Highest | 0.185 | −72% |
| B | — | 0.068 | — |
| C | — | −0.087 | — |
B+ carried the largest correction — a 72% cut to its average R — followed by A at −64% and A+ at −39%. The grades with the most degenerate-risk trades in the original sample took the biggest hit once those trades were dropped. This is exactly the direction a genuine bug fix should move the numbers: grades that were most inflated by the artifact shrink the most when the artifact is removed.
What the Correction Revealed About the Grade Ladder
The corrected numbers restored A+ average R above A's — a relationship the pre-floor data had inverted. But the more consequential finding is this: A+, A, and B+ now cluster tightly between 0.15R and 0.18R, and B+ actually leads the group on raw average R. The user-facing A+ > A > B+ tier ordering is a deliberate variance-and-reliability judgment, not a strict return ranking — and that specific ladder ordering has not itself been permutation-validated.
C is the only grade with negative expectancy (−0.087 avgR across 121,387 trades). That is the grade filter's clearest, most defensible job: rejecting the bottom bucket. Whether A+ should rank above B+ on any given day is a softer, less statistically settled question than whether C should be screened out at all — and we are saying that plainly rather than letting the tier badges imply more precision than the data supports.
Does Grading Still Add Value After the Correction
Yes — and this is the part of the correction that held up under the most scrutiny. Comparing a capped, grade-ranked portfolio against the identical book ranked purely by RS (relative strength) instead of grade, grade-ranking wins on risk-adjusted return at every position-size cap tested:
| Position cap | Grade-rank Sharpe | RS-rank Sharpe | Grade-rank R/trade | RS-rank R/trade |
|---|---|---|---|---|
| 20 | 0.77 | 0.38 | 0.130 | 0.070 |
| 15 | 0.76 | 0.55 | 0.136 | 0.107 |
| 10 | 0.70 | 0.62 | 0.140 | 0.139 |
| 5 | 0.70 | 0.65 | 0.168 | 0.164 |
Grading adds the most value in a wider, less-concentrated book — at a 20-position cap the grade-ranked Sharpe is roughly double the RS-only Sharpe. As the book concentrates down to 5 positions, grade and RS ranking converge, because a tightly concentrated book is mostly holding the highest-conviction names either way. The deployable edge lives in selection under a position cap, not in any single detector's tuning.
Out-of-Sample Durability
The corrected, floor-applied portfolio held up out of sample. The best policy (a 20-position cap, grade-ranked) produced a holdout Sharpe of 3.85 and 0.352 R per trade across 398 trades. Walk-forward testing across three separate rolling windows was positive in all three: median out-of-sample Sharpe 1.41, with individual windows at 0.76, 2.20, and 1.41.
What This Means, Plainly
This was a real calibration bug, not a rounding difference. It inflated every grade's reported edge, disproportionately for the grades that most needed the platform's credibility to hold. The fix is now the active formula version in production, the numbers above are the corrected, post-fix record, and the grade ladder's precise ordering (A+ over A over B+) is disclosed here as a judgment call rather than a statistically proven ranking — because publishing a corrected number without disclosing what it does and doesn't prove would just be a quieter version of the original problem.
What Changed and What Didn't
- Changed: every grade's average R-multiple moved down, most sharply for B+ (−72%), then A (−64%), then A+ (−39%).
- Changed: A+ now reads above A on average R, correcting a pre-floor inversion.
- Did not change: grade-based selection still beats RS-only selection at every position cap tested, and the out-of-sample walk-forward record stayed positive across all three windows.
- Did not change, and we are saying so directly: the A+ > A > B+ ordering shown to users is not itself permutation-validated as a return ranking — only the C-grade exclusion has that level of statistical support.
- Don't read a grade badge as a precise return forecast — read it as a quality filter with C excluded as the clearest, most tested part of the signal.
FAQ
See below for frequently asked questions about the risk-floor correction and what it changed.
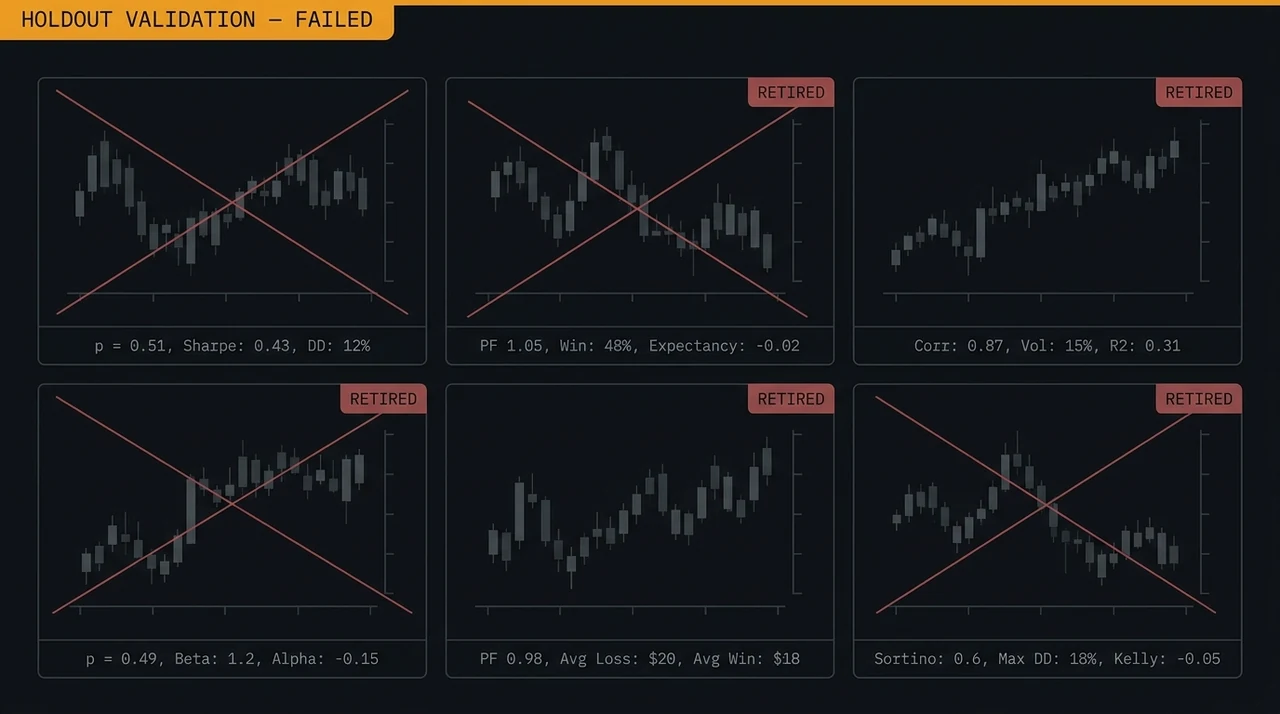
EasySwing.trading's grading model runs through the same holdout and out-of-sample validation described here on every calibration update. Read the companion post on the strategy graveyard for how individual strategies are validated, and see the full methodology and performance record. Scan results are for informational purposes only and do not constitute investment advice. See our Risk Disclaimer.
Frequently Asked Questions
What is a degenerate-risk trade in a backtest?
A degenerate-risk trade is one where the computed risk-per-share (entry price minus stop price) is close to zero — for example, when a stop sits almost exactly at the entry level. Because R-multiple divides profit by that risk figure, an almost-zero denominator inflates the resulting R-multiple far beyond what the trade's real dollar risk represents.
How does the risk floor work?
The floor sets a minimum risk-per-share equal to the greater of 0.25 times the 14-day ATR or 0.5% of the entry price. Any simulated trade whose computed risk falls below that floor is dropped from the backtest sample entirely — the risk value is not rescaled or clamped, which means the correction cannot manufacture a result that would not otherwise have occurred.
Which setup grade was affected most by the correction?
B+ carried the largest correction, with average R-multiple falling 72% once degenerate-risk trades were removed, followed by A at −64% and A+ at −39%. The grades with the most artifact-inflated trades in the original sample saw the largest downward correction — the expected direction for a genuine bug fix.
Is EasySwing's A+/A/B+/B/C grade ladder a strict return ranking?
No, and the platform discloses this directly. After the risk-floor correction, A+, A, and B+ average R-multiples cluster tightly between 0.15R and 0.18R, with B+ actually leading the group on raw average R. The tier ordering shown to users reflects a variance-and-reliability judgment rather than a permutation-validated return ranking. The one grade-level finding that is statistically well-supported is that C is the only grade with negative expectancy.
Does grade-based selection still add value after the correction?
Yes. Comparing a capped, grade-ranked portfolio against an identical book ranked by relative strength alone, grade-ranking produces a higher Sharpe ratio at every position-size cap tested, with the largest advantage (roughly double the Sharpe) at a 20-position cap. The advantage narrows as the book concentrates toward 5 positions.
Disclaimer: This article is for educational purposes only and does not constitute investment advice. EasySwing is a stock screening tool, not a registered investment advisor. All trading involves risk. Read our full disclaimer →